Creating a Custom Cluster Utilization Report
Cloudera Manager provides a Cluster Utilization Report that displays aggregated utilization information for YARN and Impala jobs. If you wish to export the data from this report, you can build custom reports based on the same metrics data using the Cloudera Manager Admin console or the Cloudera Manager API. This topic describes the metrics and queries you can use to build these custom reports. These reports all use the tsquery Language to chart time-series data.
Metrics and Queries
For more information about the Data Granularity described in these metrics, see Metric Aggregation.
Many of the metrics described below use a data granularity of hourly. This is not required, but is recommended because some of the YARN utilization metrics are only available hourly and using the hourly granularity allows for consistent reporting.
Cluster-Level CPU and Memory Metrics
- Total cluster CPU usage
-
Data Granularity: hourly
Units: percentage
tsquery:SELECT cpu_percent_across_hosts WHERE category=CLUSTER AND clusterName=Cluster_Name
- Total CPU Cores in the cluster
-
Data Granularity: hourly
Units: CPU cores
tsquery:SELECT total_cores_across_hosts WHERE category=CLUSTER AND clusterName=Cluster_Name
- Total cluster memory usage
-
Data Granularity: hourly
Units: percentage
tsquery:SELECT 100 * total_physical_memory_used_across_hosts/total_physical_memory_total_across_hosts WHERE category=CLUSTER AND clusterName=Cluster_Name
- Total cluster memory usage
-
Time series of total cluster memory usage.
Data Granularity:hourly
Units: Byte seconds
tsquery:SELECT total_physical_memory_total_across_hosts WHERE category=CLUSTER AND clusterName=Cluster_Name
- CPU used by Impala
-
Time series of total Impala CPU usage in milliseconds.
Data Granularity: hourly
Units: milliseconds
tsquery:SELECT counter_delta(impala_query_thread_cpu_time_rate) WHERE category=CLUSTER AND clusterName=Cluster_Name
- Memory used by Impala
-
Time series of Impala memory usage
Data Granularity: hourly
Units: byte seconds
tsquery:SELECT counter_delta(impala_query_memory_accrual_rate) WHERE category=CLUSTER AND clusterName=Cluster_Name
- CPU used by YARN
-
The yarn_reports_containers_used_cpu metric used in this tsquery is generated per hour, therefore the data granularity used for this query is the raw metric value.
Data Granularity: Raw
Units: percent seconds
tsquery:SELECT yarn_reports_containers_used_cpu FROM REPORTS WHERE category=SERVICE AND clusterName=Cluster_Name
- Memory used by YARN
-
Yarn memory usage. The yarn_reports_containers_used_memory metric used in this tsquery is generated per hour, therefore the data granularity used for this query is the raw metric value.
Data Granularity: raw metric value
Units: megabyte seconds
tsquery:SELECT yarn_reports_containers_used_memory FROM REPORTS WHERE category=SERVICE AND clusterName=Cluster_Name
Pool-Level CPU and Memory Metrics
- CPU used by Impala pool
-
CPU usage for an Impala pool.
Data Granularity: hourly
Units: milliseconds
tsquery:SELECT counter_delta(impala_query_thread_cpu_time_rate) WHERE category=IMPALA_POOL AND poolName=Pool_Name
- Memory used by Impala pool
-
Data Granularity: hourly
Units: byte seconds
tsquery:SELECT counter_delta(impala_query_memory_accrual_rate) WHERE category=IMPALA_POOL AND poolName=Pool_Name
- CPU used by YARN pool
-
Provides CPU metrics per YARN pool and user. You can aggregate a pool-level metric from this query.
- Memory used by YARN pool
-
Provides memory metrics per YARN pool and user. You can aggregate a pool-level metric from this query.
Data Granularity: hourly
Units: megabyte seconds
tsquery:SELECT yarn_reports_containers_used_memory FROM REPORTS WHERE category=YARN_POOL_USER
YARN Metrics
- YARN VCore usage
-
Data Granularity: Raw
Units: VCore seconds
tsquery:SELECT yarn_reports_containers_used_vcores FROM REPORTS WHERE category=SERVICE AND clusterName=Cluster_Name
- Total VCores available to YARN
-
Data Granularity: hourly
Units: Number of VCores (Note that this value is not multiplied by the time unit.)
tsquery:SELECT total_allocated_vcores_across_yarn_pools + total_available_vcores_across_yarn_pools WHERE category=SERVICE AND clusterName=Cluster_Name
- YARN Memory usage
-
Data Granularity: Raw
Units: MB seconds
tsquery:SELECT yarn_reports_containers_used_memory FROM REPORTS WHERE category=SERVICE AND clusterName=Cluster_Name
- Total memory available to YARN
-
Data Granularity: hourly
Units: MB (Note that this value is not multiplied by the time unit.)
tsquery:SELECT total_available_memory_mb_across_yarn_pools + total_allocated_memory_mb_across_yarn_pools WHERE category=SERVICE AND clusterName=Cluster_Name
- Pool-level VCore usage
-
The results of this query return the usage for each user in each pool. To see the total usage for a pool, sum all users of the pool.
Data Granularity: Raw
Units: VCore seconds
tsquery:SELECT yarn_reports_containers_used_vcores FROM REPORTS WHERE category=YARN_POOL_USER
To view metrics for a specific pool, add poolName=Pool Name to the tsquery statement.
- Pool-level memory usage
-
The results of this query return the usage for each user in each pool. To see the total usage for a pool, sum all users of the pool.
Data Granularity: Raw
Units: MB seconds
tsquery:SELECT yarn_reports_containers_used_memory FROM REPORTS WHERE category=YARN_POOL_USER
To view metrics for a specific pool, add poolName=Pool Name to the tsquery statement.
- Pool-level allocated VCores
-
The results of this query return the usage for each user in each pool. To see the total usage for a pool, sum all users of the pool.
Data Granularity: raw metric value
Units: VCore seconds
tsquery:SELECT yarn_reports_containers_allocated_vcores FROM REPORTS WHERE category=YARN_POOL_USER
To view metrics for a specific pool, add poolName=Pool Name to the tsquery statement.
- Pool-level allocated memory
-
The results of this query return the usage for each user in each pool. To see the total usage for a pool, sum all users of the pool.
Data Granularity: raw metric value
Units: megabyte seconds
tsquery:SELECT yarn_reports_containers_allocated_memory FROM REPORTS WHERE category=YARN_POOL_USER
To view metrics for a specific pool, add poolName=Pool Name to the tsquery statement.
- Pool-level steady fair share VCore
-
Data Granularity: hourly
Units: VCores
tsquery:SELECT steady_fair_share_vcores WHERE category=YARN_POOL
To view metrics for a specific pool, add poolName=Pool Name to the tsquery statement.
- Pool-level fair share VCore
-
Data Granularity: hourly
Units: VCores
tsquery:SELECT fair_share_vcores WHERE category=YARN_POOL
- Pool-level steady fair share memory
-
Data Granularity: hourly
Units: MB
tsquery:SELECT steady_fair_share_mb WHERE category=YARN_POOL
To view metrics for a specific pool, add poolName=Pool Name to the tsquery statement.
- Pool-level fair share memory
-
Data Granularity: hourly
Units: MB
tsquery:SELECT fair_share_mb WHERE category=YARN_POOL
To view metrics for a specific pool, add poolName=Pool Name to the tsquery statement.
- Metric indicating contention
-
Data Granularity: hourly
Units: percentage
tsquery:SELECT container_wait_ratio WHERE category=YARN_POOL
To view metrics for a specific pool, add poolName=Pool Name to the tsquery statement.
YARN Contention-Related Metrics
Use the following metrics to monitor resource contention.
- Pool-level allocated VCores when contention occurs
-
Data Granularity: hourly
Units: VCores
tsquery:SELECT allocated_vcores_with_pending_containers WHERE category=YARN_POOL
To view metrics for a specific pool, add poolName=Pool Name to the tsquery statement.
- Pool level steady fair share VCores when contention occurs
-
Data Granularity: hourly
Units: VCores
tsquery:SELECT steady_fair_share_vcores_with_pending_containers WHERE category=YARN_POOL
To view metrics for a specific pool, add poolName=Pool Name to the tsquery statement.
- Pool level fair share VCores when contention occurs
-
Data Granularity: hourly
Units: VCores
tsquery:SELECT fair_share_vcores_with_pending_containers WHERE category=YARN_POOL
To view metrics for a specific pool, add poolName=Pool Name to the tsquery statement.
- Pool level allocated memory when contention occurs
-
Data Granularity: hourly
Units: MB
tsquery:SELECT allocated_memory_mb_with_pending_containers WHERE category=YARN_POOL
To view metrics for a specific pool, add poolName=Pool Name to the tsquery statement.
- Pool level steady fair share memory when contention occurs
-
Data Granularity: hourly
Units: MB
tsquery:SELECT steady_fair_share_mb_with_pending_containers WHERE category=YARN_POOL
To view metrics for a specific pool, add poolName=Pool Name to the tsquery statement.
- Pool level fair share memory when contention occurs
-
Data Granularity: hourly
Units: MB
tsquery:SELECT fair_share_mb_with_pending_containers WHERE category=YARN_POOL
To view metrics for a specific pool, add poolName=Pool Name to the tsquery statement.
Impala-Specific Metrics
To view metrics for a specific pool, add poolName=Pool Name to the tsquery statement.
- Total reserved memory
-
Data Granularity: hourly
Units: MB seconds
tsquery:SELECT total_impala_admission_controller_local_backend_mem_reserved_across_impala_daemon_pools WHERE category=CLUSTER AND clusterName=Cluster_Name
- Total used memory
-
Data Granularity: hourly
Units: MB seconds
tsquery:SELECT total_impala_admission_controller_local_backend_mem_usage_across_impala_daemon_pools WHERE category=CLUSTER AND clusterName=Cluster_Name
- Total available memory
-
Data Granularity: hourly
Units: MB seconds
tsquery:SELECT total_mem_tracker_process_limit_across_impalads WHERE category=CLUSTER AND clusterName=Cluster_Name
Impala Query Counter Metrics
- counter_delta(queries_ingested_rate)
- counter_delta(queries_successful_rate)
- counter_delta(queries_rejected_rate)
- counter_delta(queries_oom_rate)
- counter_delta(queries_timed_out_rate)
- counter_delta(impala_query_admission_wait_rate)
- counter_delta(impala_query_memory_spilled_rate)
For example:
SELECT
   counter_delta(queries_ingested_rate)
 WHERE
   category=IMPALA_POOL
   AND clusterName=Cluster_Name
   AND serviceName=Service_Name
Calculations for reports
All the metrics listed in this topic return a time series of metric values. Depending on the collection frequency of the metric itself and the data granularity you use when issuing tsquery statements, the results return metric values in different frequencies and therefore there are different ways to handle the metric values.
-
YARN container metrics are generated once per hour resulting in one raw metric value every hour. Therefore, the most detailed results possible for YARN CPU and memory usage are hourly reports.
-
Hourly aggregates are summarized from raw metric values. These aggregates include a set of statistics that include the sum, maximum, minimum, count and other statistics that summarize the raw metric values. When you use the hourly granularity, you lose the single values of the raw metric values. However, you can still get peak usage data for such metrics. For more information, see Metric Aggregation.
-
For some of the YARN metrics described in this topic, the tsquery statement aggregates from the pool and user level to pool level in the Cloudera Manager Cluster Utilization reports. For these queries, because the maximum and minimum for different pool and user combinations are not likely to happen at the same time, there is no way to get the peak usage across pool and user combinations, or at the pool level. The only meaningful results possible are average and sum.
-
When calculating CPU/Memory usage percentage, pay attention to the units for each metric. For example, if the cluster consistently has 8 VCores, the total VCore seconds for each hour would be 8 * 3600 VCore seconds. You can then use this adjusted number to compare with the VCore seconds used by YARN or YARN pools.
Retrieving metric data using the Cloudera Manager API
There is a Time series endpoint exposed by the Cloudera Manager REST API. See Cloudera Manager API documentation timeseries Endpoint. The API accepts tsquery statements as input for which metrics need to be retrieved during the specified time window. The API provides functionality to specify the desired data granularity (for example, raw metric values, TEN_MINUTES, HOURLY etc.). Each granularity level of data is maintained in a leveldb table (see Data Granularity and Time-Series Metric Data). This data is aggregated from raw metric values such as minimum, maximum, etc. within the corresponding data window.
For example, if you do not need the metric data at a specific timestamp but care more about the hourly usage, HOURLY data should be good enough. In general, the longer the granular window it is, the less storage it is taking, and thus the longer period of time you are able to keep that level of data without being purged when the storage hits the configured limit. In the case of Cloudera Manager Cluster Utilization Reports, Cloudera Manager generates the reports based on an hourly window.
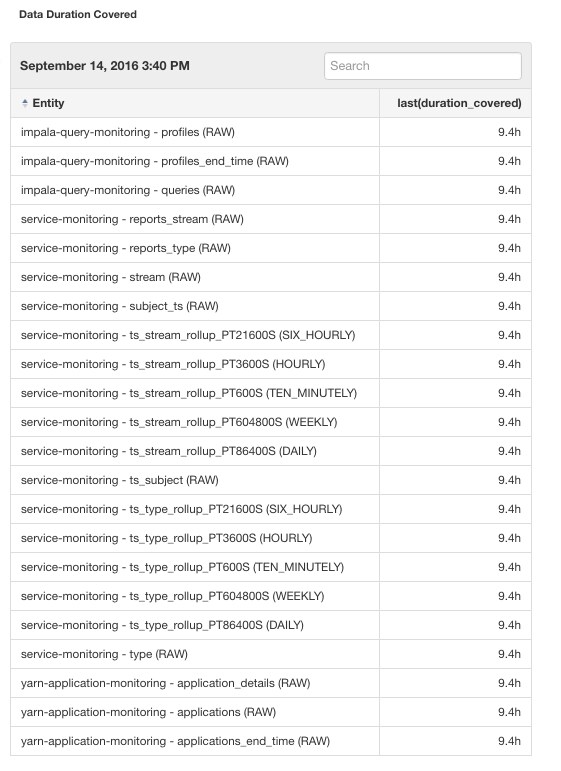
To view the Cloudera Manager Service Monitor data storage granularities, go to and scroll down to see the Data Duration Covered table to see the earliest available data points for each level of granularity. The
value in the last(duration_covered) column indicates the age of the oldest data in the table.
To configure the Time series storage used by the Service Monitor, go to and search for "Time-Series Storage".
Querying metric data using the Cloudera Manager Admin Console
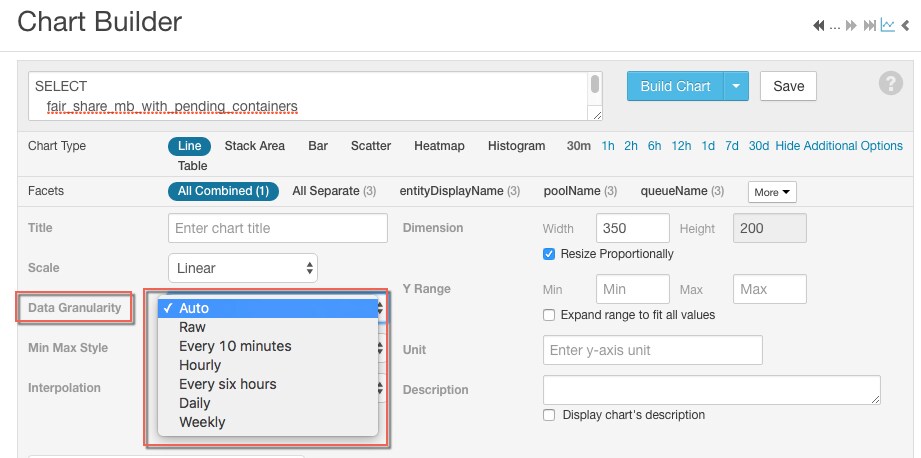
To build charts that query time series data using the Cloudera Manager Admin console, go to . When building charts, it may be useful to choose the data granularity by clicking the Show additional options link on the chart builder page and then selecting the Data Granularity drop-down list. See Charting Time-Series Data.
Selecting data granularity in chart builder: