Metric Aggregation
In addition to collecting and storing raw metric values, the Cloudera Manager Service Monitor and Host Monitor produce a number of aggregate metrics from the raw metric data. Where a raw data point is a timestamp value pair, an aggregate metric point is a timestamp paired with a bundle of statistics including the minimum, maximum, average, and standard deviation of the data points considered by the aggregate.
Individual metric streams are aggregated across time to produce statistical summaries at different data granularities. For example, an individual metric stream of the number of open file descriptors on a host will be aggregated over time to the ten-minute, hourly, six-hourly, daily and weekly data granularities. A point in the hourly aggregate stream will include the maximum number of open file descriptors seen during that hour, the minimum, the average and so on. When servicing a time-series request, either for the Cloudera Manager UI or API, the Service Monitor and Host Monitor automatically choose the appropriate data granularity based on the time-range requested.
Cross-Time Aggregate Example
Consider the following fd_open raw metric values for a host:
9:00, 100 fds
9:01, 101 fds
9:02, 102 fds
. . .
9:09, 109 fds
The ten minutely cross-time aggregate point covering the ten-minute window from 9:00 - 9:10 would have the following statistics and metadata:
min: 100 fds
min timestamp: 9:00
max 109 fds
max timestamp 9:09
mean 104.5 fds
standard deviation: 3.02765 fds
count: 10 points
sample: 109 fds
sample timestamp: 9:09
The Service Monitor and Host Monitor also produce cross-entity aggregates for a number of entities in the system. Cross-entity aggregates are produced by considering the metric value of a particular metric across a number of entities of the same type at a particular time. For each stream considered, two metrics are produced. The first tracks statistics such as the minimum, maximum, average and standard deviation across all considered entities as well as the identities of the entities that had the minimum and maximum values. The second tracks the sum of the metric across all considered entities.
An example of the first type of cross-entity aggregate is the fd_open_across_datanodes metric. For an HDFS service this metric contains aggregate statistics on the fd_open metric value for all the DataNodes in the service. For a rack this metric contains statistics for all the DataNodes within that rack, and so on. An example of the second type of cross-entity aggregate is the total_fd_open_across_datanodes metric. For an HDFS service this metric contains the total number of file descriptors open by all the DataNodes in the service. For a rack this metric contains the total number of file descriptors open by all the DataNodes within the rack, and so on. Note that unlike the first type of cross-entity aggregate, this total type of cross-entity aggregate is a simple timestamp, value pair and not a bundle of statistics.
Cross-Entity Aggregate Example
Consider the following fd_open raw metric values for a set of ten DataNodes in an HDFS service at a given timestamp:
datanode-0, 200 fds
datanode-1, 201 fds
datanode-2, 202 fds
…
datanode-9, 209 fds
min: 200 fds
min entity: datanode-0
max: 209 fds
max entity: datanode-9
mean: 204.5 fds
standard deviation: 3.02765 fds
count: 10 points
sample: 209 fds
sample entity: datanode-9
Just like every other metric, cross-entity aggregates are aggregated across time. For example, a point in the hourly aggregate of fd_open_across_datanodes for an HDFS service will include the maximum fd_open value of any DataNode in that service over that hour, the average value over the hour, and so on. A point in the hourly aggregate of total_fd_open_across_datanodes for an HDFS service will contain statistics on the value of the total_fd_open_across_datanodes for that service over the hour.
Presentation of Aggregate Data
Aggregate data points returned from the Cloudera Manager API appear as shown in this section.
A cross-time aggregate:
{
        "timestamp" : "2014-02-24T00:00:00.000Z",
        "value" : 0.014541698027508003,
        "type" : "SAMPLE",
        "aggregateStatistics" : {
          "sampleTime" : "2014-02-23T23:59:35.000Z",
          "sampleValue" : 0.0,
          "count" : 360,
          "min" : 0.0,
          "minTime" : "2014-02-23T18:00:35.000Z",
          "max" : 2.9516129032258065,
          "maxTime" : "2014-02-23T19:37:36.000Z",
          "mean" : 0.014541698027508003,
          "stdDev" : 0.17041289765265377
        }
      }
A raw cross-entity aggregate:
{
        "timestamp" : "2014-03-26T00:50:15.725Z",
        "value" : 3288.0,
        "type" : "SAMPLE",
        "aggregateStatistics" : {
          "sampleTime" : "2014-03-26T00:49:19.000Z",
          "sampleValue" : 7232.0,
          "count" : 4,
          "min" : 1600.0,
          "minTime" : "2014-03-26T00:49:42.000Z",
          "max" : 7232.0,
          "maxTime" : "2014-03-26T00:49:19.000Z",
          "mean" : 3288.0,
          "stdDev" : 2656.7549127961856,
          "crossEntityMetadata" : {
            "maxEntityDisplayName" : "cleroy-9-1.ent.cloudera.com",
            "minEntityDisplayName" : "cleroy-9-4.ent.cloudera.com",
            "numEntities" : 4.0
          }
        }
      }
A cross-time, cross-entity aggregate:
{
        "timestamp" : "2014-03-11T00:00:00.000Z",
        "value" : 3220.818863879957,
        "type" : "SAMPLE",
        "aggregateStatistics" : {
          "sampleTime" : "2014-03-10T22:28:48.000Z",
          "sampleValue" : 7200.0,
          "count" : 933,
          "min" : 1536.0,
          "minTime" : "2014-03-10T21:02:17.000Z",
          "max" : 7200.0,
          "maxTime" : "2014-03-10T22:28:48.000Z",
          "mean" : 3220.818863879957,
          "stdDev" : 2188.6143063503378,
          "crossEntityMetadata" : {
            "maxEntityDisplayName" : "cleroy-9-1.ent.cloudera.com",
            "minEntityDisplayName" : "cleroy-9-4.ent.cloudera.com",
            "numEntities" : 3.9787037037037036
          }
        }
      }
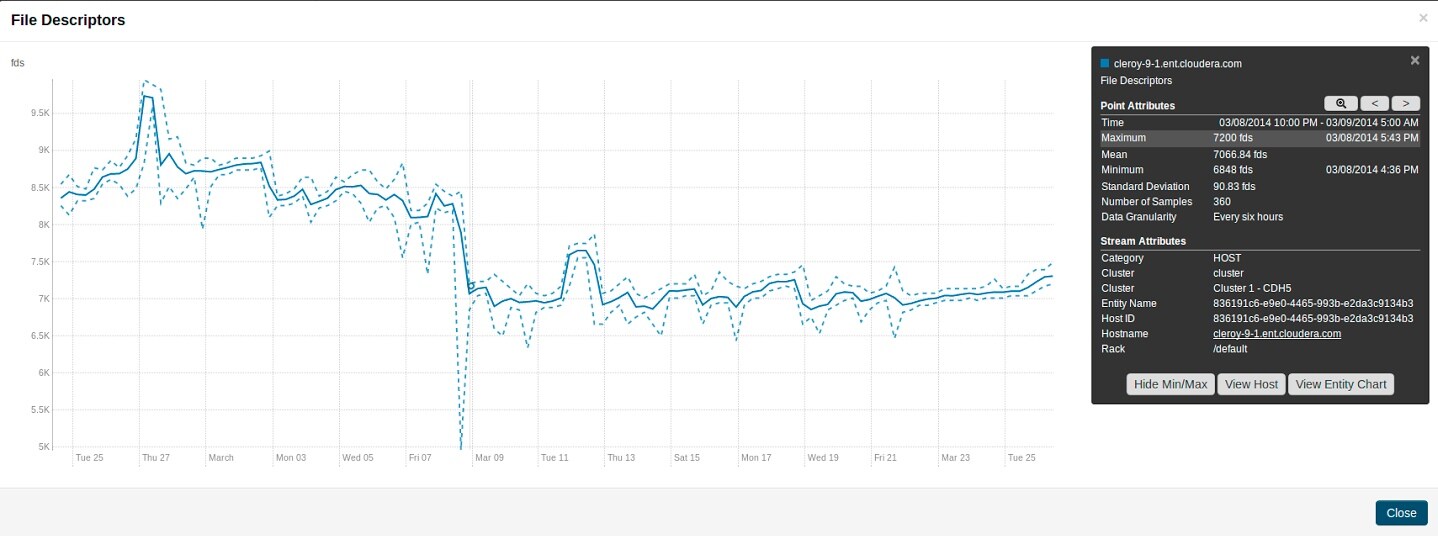
These differ from non-aggregate data points by having the aggregateStatistics structure. Note that the value field in the point structure will always be the same as the aggregteStatistics mean field. The Cloudera Manager UI presents aggregate statistics in a number of ways. First, aggregate statistics are made available in the hover detail and chart popover when dealing with aggregate data. Second, it is possible to turn on and turn off the display of minimum and maximum time-series streams in line charts of aggregate data. These streams are displayed using dotted lines and give a visual indication of the underlying metric values data range over the time considered, entities considered or both. These lines are displayed by default for single stream line charts of aggregate data. For all line charts this behavior can be turned on and turned off using the chart popover.
Accessing Aggregate Statistics Through tsquery
The stats function can be used to access aggregate statistics directly in tsquery. For example, select stats(fd_open_across_datanodes, max) where category = service and serviceDisplayName = “my-hdfs-service” will return a single time-series stream containing the just the maximum statistic values from the fd_open_across_datanodes stream. The following statistics are available through the stats function: min, max, avg, std_dev, and sample. See tsquery Language for more details on the stats function.