tsquery Language
The tsquery language is used to specify statements for retrieving time-series data from the Cloudera Manager time-series datastore.
Continue reading:
- Retrieve time series for all metrics for all DataNodes.
select * where roleType=DATANODE
- Retrieve cpu_user_rate metric time series for all DataNodes.
select cpu_user_rate where roleType=DATANODE
- Retrieve the jvm_heap_used_mb metric time series divided by 1024 and the jvm_heap_committed metric time series divided by 1024 for all roles running on the host named "my host".
select jvm_heap_used_mb/1024, jvm_heap_committed_mb/1024 where category=ROLE and hostname="my host"
- Retrieve the jvm_total_threads and jvm_blocked_threads metric time series for all
entities for which Cloudera Manager collects these two metrics.
select jvm_total_threads,jvm_blocked_threads
tsquery Syntax
A tsquery statement has the following structure:
SELECT [metric expression]WHERE [predicate]
- The statement select * is invalid.
- Tokens are case insensitive. For example, Select, select, and SeLeCt are all equivalent to SELECT.
- Multiple statements can be concatenated with semi-colons. Thus example 3 can be written as:
select jvm_heap_used_mb/1024 where category=ROLE and hostname=myhost; select jvm_heap_commited_mb/1024 where category=ROLE and hostname=myhost
- The metric expression can be replaced with an asterisk (*), as shown in example 1. In that case, all metrics that are applicable for selected entities, such as DATANODE in example 1, are returned.
- The predicate can be omitted, as shown in example 4. In such cases, time series for all entities for which the metrics are appropriate are returned. For this query you would see the jvm_new_threads metric for NameNodes, DataNodes, TaskTrackers, and so on.
Metric Expressions
A metric expression generates the time series. It is a comma-delimited list of one or more metric expression statements. A metric expression statement is the name of a metric, a metric expression function, or a scalar value, joined by one or more metric expression operators.
See the FAQ which answers questions concerning how to discover metrics and use cases for scalar values. For a list of all the supported metrics, see Cloudera Manager Metrics.
Metric expressions support the binary operators: +, -, *, /.
- jvm_heap_used_mb, cpu_user, 5
- 1000 * jvm_gc_time_ms / jvm_gc_count
- total_cpu_user + total_cpu_system
- max(total_cpu_user)
Metric Expression Functions
Metric expressions support the functions listed in the following table. A function can return a time series or a scalar computed from a time series.
Functions that return scalars must be used for heatmap charts.
| Function | Returns Scalar? | Description |
|---|---|---|
| avg(metric expression) | N | Computes a simple average for a time series. |
| count_service_roles() | Y | Returns the number of roles. There are three variants of this function:
|
| dt(metric expression) | N | Derivative with negative values. The change of the underlying metric expression per second. For example: dt(jvm_gc_count). |
| dt0(metric expression) | N | Derivative where negative values are skipped (useful for dealing with counter resets). The change of the underlying metric expression per second. For example: dt0(jvm_gc_time_ms) / 10. |
| getClusterFact(string factName, double defaultValue) | Y | Retrieves a fact about a cluster. Currently supports one fact: numCores. If the number of cores cannot be determined, defaultValue is returned. |
| getHostFact(string factName, double defaultValue) | Y | Retrieves a fact about a host. Currently supports one fact: numCores.
If the number of cores cannot be determined, defaultValue is returned.
For example, select dt(total_cpu_user) / getHostFact(numCores, 2) where category=HOST divides the results of dt(total_cpu_user) by the current number of cores for each host. The following query computes the percentage of total user and system CPU usage each role is using on the host. It first computes the CPU seconds per second for the number of cores used
by taking the derivative of the total user and system CPU times. It normalizes the result to the number of cores on the host by using the getHostFact function and
multiplies the result by 100 to get the percentage.
select dt0(total_cpu_user)/getHostFact(numCores,1)*100, dt0(total_cpu_system)/getHostFact(numCores,1)*100 where category=ROLE and clusterId=1 |
| greatest(metric expression, scalar metric expression) | N | Compares two metric expressions, one of which one is a scalar metric expression. Returns a time series where each point is the result of evaluating max(point, scalar metric expression). |
| integral(metric expression) | N | Computes the integral value for a stream and returns a time-series stream within which each data point is the integral value of the corresponding data point from the original stream. For example, select integral(maps_failed_rate) will return the count of the failed number of maps. |
| counter_delta(metric expression) | N | Computes the difference in counter value for a stream and returns a time-series stream within which each data point is
the difference in counter value of the corresponding data point from the counter value of previous data point in the original stream. For example: select
counter_delta(maps_failed_rate) returns the count of the failed number of maps. This method is more accurate than the integral() function. However there are a
few caveats:
|
| last(metric expression) | Y | Returns the last point of a time series. For example, to use the last point of the cpu_percent metric time series, use the expression select last(cpu_percent). |
| least(metric expression, scalar metric expression) | N | Compares two metric expressions, of which one is a scalar metric expression. Returns a time series where each point is the result of evaluating min(point, scalar metric expression). |
| max(metric expression) | Y | Computes the maximum value of the time series. For example, select max(cpu_percent). |
| min(metric expression) | Y | Computes the minimum value of the time series. |
| moving_avg(metric expression, time_window_sec) | N | Computes the moving average for a time series over a time window time_window_sec specified in seconds (2, 0.1, and so on) |
| stats(metric expression, stats name) | N | Some time-series streams have additional statistics for each data point. These include rollup time-series streams, cross-entity aggregates, and rate metrics. The following statistics are available for rollup and cross-entity aggregates: max, min, avg, std_dev, and sample. For rate metrics, the underlying counter value is available using the "counter" statistics. For example, stats(fd_open_across_datanodes, max) or stats(swap_out_rate, counter). |
| sum(metric expression) | Y | Computes the sum value of the time-series. |
Predicates
- time_series_attribute operator value, where
- time_series_attribute is one of the supported attributes.
- operator is one of = and rlike
- value is an attribute value subject to the following constraints:
- For attributes values that contain spaces or values of attributes of the form xxxName such as displayName, use quoted strings.
- The value for the rlike operator must be specified in quotes. For example: hostname rlike "host[0-3]+.*".
- value can be any regular expression as specified in regular expression constructs in the Java Pattern class documentation.
- scalar_producing_function(metric_expression) comparator
number, where
- scalar_producing_function is any function that takes a time series and produces a scalar. For example, min or max.
- metric_expression is a valid metric expression. For example, total_cpu_user + total_cpu_system.
- comparator is a comparison operator: <, <=, =, !=, >=, >.
- number is any number expression or a number expression with units. For example, 5, 5mb,
5s are all valid number expressions. The valid units are:
- Time - ms (milliseconds), s (seconds), m (minutes), h (hours), and d (days).
- Bytes -b (bytes), kb or kib (kilobytes), mb or mib (megabytes), gb or gib (gigabytes), tb or tib (terabytes), and pb or pib (petabytes)
- Bytes per second - Bytes and Time: bps, kbps, kibps, mbps, mibps, and so on. For example, 5 kilobytes per second is 5 kbps.
- Bytes time - Bytes and Time combined: bms, bs, bm, bh, bd, kms, ks, and so on. For example, 5 kilobytes seconds is 5 ks or 5 kis.
You use the AND and OR operators to compose compound predicates.
Example Statements with Compound Predicates
- Retrieve all time series for all metrics for DataNodes or TaskTrackers.
select * where roleType=DATANODE or roleType=TASKTRACKER
- Retrieve all time series for all metrics for DataNodes or TaskTrackers that are running on host named "myhost".
select * where (roleType=DATANODE or roleType=TASKTRACKER) and hostname=myhost
- Retrieve the total_cpu_user metric time series for all hosts with names that match the regular expression "host[0-3]+.*"
select total_cpu_user where category=role and hostname rlike "host[0-3]+.*"
Example Statements with Predicates with Scalar Producing Functions
- Return the entities where the last count of Java VM garbage collections was greater than 10:
select jvm_gc_count where last(jvm_gc_count) > 10
- Return the number of open file descriptors where processes have more than 500Mb of mem_rss:
select fd_open where min(mem_rss) > 500Mb
Filtering by Day of Week or Hour of Day
You can add an expression to the predicate of a tsquery statement that limits the stream to specified days of the week or to a range of hours in each day.
By Day – Limits the stream to selected days of the week.
day in (#, #, ...)
day in (1,2,3,4,5)
By Hour – Limits the stream to a range of hours each day.
hour in [#:#]
hour in [9:17]
Add the day or time range expression after the WHERE clause. Do not use the AND keyword. For example:
select fd_open where category = ROLE and roleType = SERVICEMONITOR day in (1,2,3,4,5)
select fd_open where category = ROLE and roleType = SERVICEMONITOR day in (1,2,3,4,5) hour in [9:17]
Time Series Attributes
Attribute names and most attribute values are case insensitive. displayName and serviceType are two attributes whose values are case sensitive.
| Name | Description |
|---|---|
| active | Indicates whether the entities to be retrieved must be active. A nonactive entity is an entity that has been removed or deleted from
the cluster. The default is to retrieve only active entities (that is, active=true). To access time series for deleted or removed entities, specify active=false in the query. For example:
SELECT fd_open WHERE roleType=DATANODE and active=false |
| agentName | A Flume agent name. |
| applicationName | One of the Cloudera Manager monitoring daemon names. |
| cacheId | The HDFS cache directive ID. |
| category | The category of the entities returned by the query: CLUSTER, DIRECTORY, DISK, FILESYSTEM, FLUME_SOURCE, FLUME_CHANNEL, FLUME_SINK, HOST, HTABLE, IMPALA_QUERY_STREAM, NETWORK_INTERFACE, ROLE, SERVICE, USER, YARN_APPLICATION_STREAM, YARN_QUEUE.
Some metrics are collected for more than one type of entity. For example, total_cpu_user is collected for entities of category HOST and ROLE. To retrieve the data only for hosts use:
select total_cpu_user where category=HOST The ROLE category applies to all role types (see roleType attribute). The SERVICE category applies to all service types (see serviceType attribute). For example, to retrieve the committed heap for all roles on host1 use: select jvm_committed_heap_mb where category=ROLE and hostname="host1" |
| clusterDisplayName | The user-defined display name of a cluster. |
| clusterName | The cluster ID. To specify the cluster by its display name, use the clusterDisplayName attribute. |
| componentName | A Flume component name. For example, channel1, sink1. |
| device | A disk device name. For example, sda. |
| displayName | The display name of an entity. |
| entityName | A display name plus unique identifier. For example: HDFS-1-DATANODE-692d141f436ce70aac080aedbe83f887. |
| expired | A Boolean that indicates whether an HDFS cache directive expired. |
| groupName | A user group name. |
| hbaseNamespace | The name of the HBase namespace. |
| hostId | The canonical identifier for a host in Cloudera Manager. It is unique and immutable. For example: 3d645222-2f7e-4895-ae51-cd43b91f1e7a. |
| hostname | A hostname. |
| hregionName | The HBase region name. For example, 4cd887662e5c2f3cd5dd227bb03dd760. |
| hregionStartTimeMs | Milliseconds from UNIX epoch since Cloudera Manager monitoring started collecting metrics for the HBase region. |
| htableName | The name of an HBase table. |
| iface | A network interface name. For example, eth0. |
| logicalPartition | A Boolean indicating whether or not the disk is a logical partition. Applies to disk entity types. |
| mountpoint | A mount point name. For example, /var, /mnt/homes. |
| nameserviceName | The name of the HDFS nameservice. |
| ownerName | The owner user name. |
| partition | A partition name. Applies to partition entity types. |
| path | A filesystem path associated with the time-series entity. |
| poolName | A pool name. For example, hdfs cache pool, yarn pools. |
| queueName | The name of a YARN queue. |
| rackId | A Rack ID. For example, /default. |
| roleConfigGroup | The role group that a role belongs to. |
| roleName | The role ID. For example, HBASE-1-REGIONSERVER-0b0ad09537621923e2b460e5495569e7. |
| roleState | The role state: BUSY, HISTORY_NOT_AVAILABLE, NA, RUNNING, STARTING, STOPPED, STOPPING, UNKNOWN |
| roleType | The role type: ACTIVITYMONITOR, AGENT, ALERTPUBLISHER, BEESWAX_SERVER, CATALOGSERVER, DATANODE, EVENTSERVER, FAILOVERCONTROLLER, HBASE_INDEXER, HBASERESTSERVER, HBASETHRIFTSERVER, HIVEMETASTORE, HIVESERVER2, HOSTMONITOR, HTTPFS, HUESERVER, IMPALAD, JOBHISTORY,JOBTRACKER, JOURNALNODE, KT_RENEWER, LLAMA, MASTER, NAVIGATOR, REGIONSERVER, SERVICEMONITOR, NAMENODE, NODEMANAGER, REPORTSMANAGER, SECONDARYNAMENODE, SERVER, SOLR_SERVER, SQOOP_SERVER, STATESTORE, TASKTRACKER. |
| rollup | The time-series store table rollup type. |
| schedulerType | The scheduler type associated with the pool service. |
| serviceDisplayName | The user-defined display name of a service entity. |
| serviceName | The service ID. To specify a service by its display name use the serviceDisplayName attribute. |
| serviceState | The service state: HISTORY_NOT_AVAILABLE, NA, RUNNING, STARTING, STOPPED, STOPPING, UNKNOWN |
| serviceType | The service type: ACCUMULO,FLUME, HDFS, HBASE, HIVE, HUE, IMPALA, KS_INDEXER, MAPREDUCE, MGMT, OOZIE,SOLR, SPARK,SQOOP,YARN, ZOOKEEPER. |
| solrCollectionName | The Solr collection name. For example, my_collection. |
| solrReplicaName | The Solr replica name. For example, my_collection_shard1_replica1. |
| solrShardName | The Solr shard name. For example, shard1. |
| systemTable | A boolean indicating whether the HBase table is a system table or not. |
| tableName | The name of a table. |
| userName | The name of the user. |
| version | The version of the cluster. The value can be any of the supported CDH major versions: 4 for CDH 4 and 5 for CDH 5. |
Time Series Entities and their Attributes
The following table shows the entities and associated attributes that can appear in the predicate ("where" clause) of a tsquery statement.
| Entity | Attributes |
|---|---|
| All Roles | roleType, hostId, hostname, rackId, serviceType, serviceName |
| All Services | serviceName, serviceType, clusterId, version, serviceDisplayName, clusterDisplayName |
| Agent | roleType, hostId, hostname, rackId, serviceType, serviceName, clusterId, version, agentName, serviceDisplayName, clusterDisplayName |
| Cluster | clusterId, version, clusterDisplayName |
| Directory | roleName, hostId, path, roleType, hostname, rackId, serviceType, serviceName, clusterId, version, agentName, hostname, clusterDisplayName |
| Disk | device, logicalPartition, hostId, rackId, clusterId, version, hostname, clusterDisplayName |
| File System | hostId, mountpoint, rackId, clusterId, version, partition, hostname, clusterDisplayName |
| Flume Channel | serviceName, hostId, rackId, roleName, flumeComponent, roleType, serviceType, clusterId, version, agentName, serviceDisplayName, clusterDisplayName |
| Flume Sink | serviceName, hostId, rackId, roleName, flumeComponent, roleType, serviceType, clusterId, version, agentName, serviceDisplayName, clusterDisplayName |
| Flume Source | serviceName, hostId, rackId, roleName, flumeComponent, roleType, serviceType, clusterId, version, agentName, serviceDisplayName, clusterDisplayName |
| HDFS Cache Pool | serviceName, poolName, nameserviceName, serviceType, clusterId, version, groupName, ownerName, serviceDisplayName, clusterDisplayName |
| HNamespace | serviceName, namespaceName, serviceType, clusterId, version, serviceDisplayName, clusterDisplayName |
| Host | hostId, rackId, clusterId, version, hostname, clusterDisplayName |
| HRegion | htableName, hregionName, hregionStartTimeMs, namespaceName, serviceName, tableName, serviceType, clusterId, version, roleType, hostname, roleName, hostId, rackId , serviceDisplayName, clusterDisplayName |
| HTable | namespaceName, serviceName, tableName, serviceType, clusterId, version, serviceDisplayName, clusterDisplayName |
| Network Interface | hostId, networkInterface, rackId, clusterId, version, hostname, clusterDisplayName |
| Rack | rackId |
| Service | serviceName, serviceType, clusterId, serviceDisplayName |
| Solr Collection | serviceName, serviceType, clusterId, version, serviceDisplayName, clusterDisplayName |
| Solr Replica | serviceName, solrShardName, solrReplicaName, solrCollectionName, serviceType, clusterId, version, roleType, hostId, hostname, rackId, roleName, serviceDisplayName, clusterDisplayName |
| Solr Shard | serviceName, solrCollectionName, solrShardName, serviceType, clusterId, version, serviceDisplayName, clusterDisplayName |
| Time Series Table | tableName, roleName, roleType, applicationName, rollup, path |
| User | userName |
| YARN Pool | serviceName, queueName, schedulerType |
FAQ
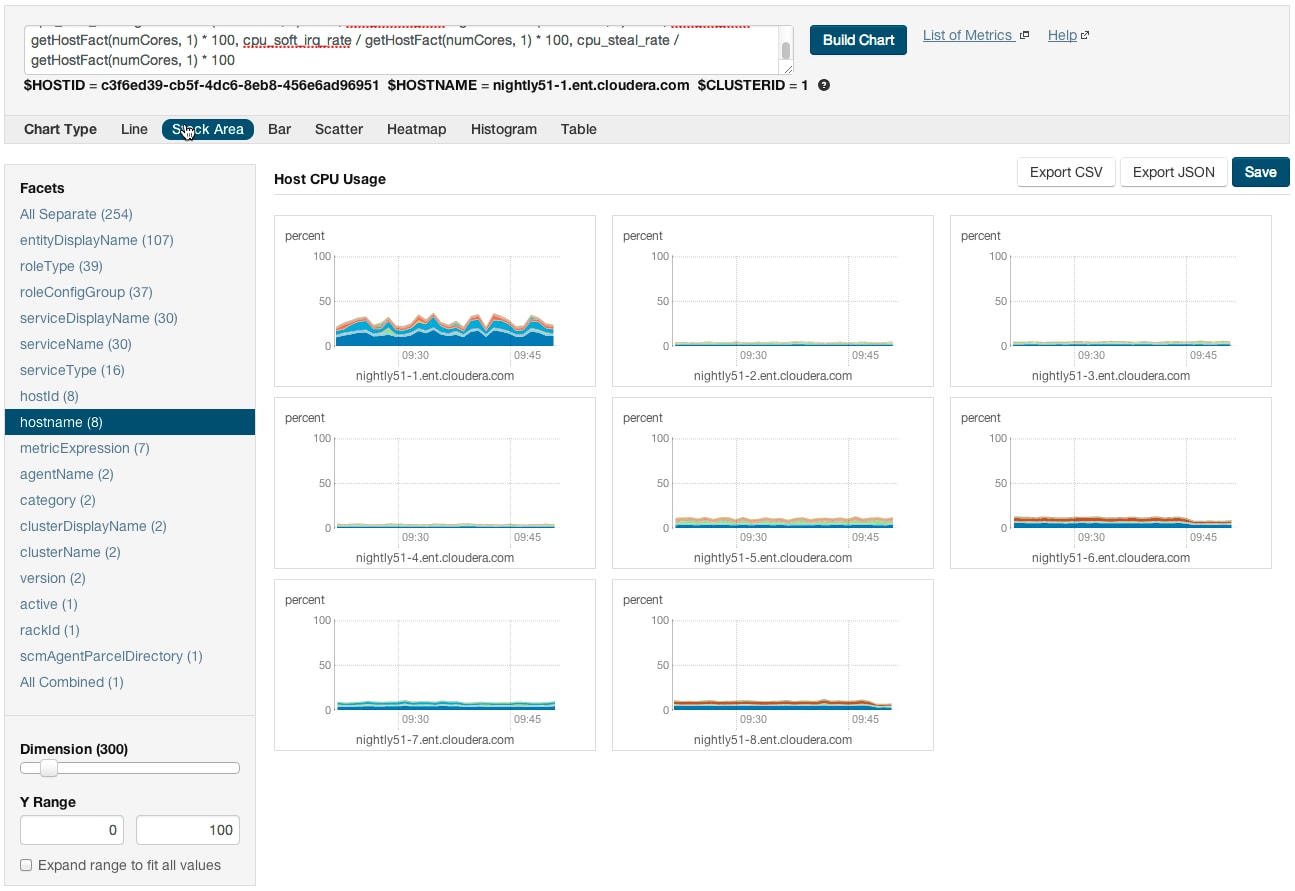
- How do I compare information across hosts?
-
- Click Hosts in the top navigation bar and click a host link.
- In the Charts pane, choose a chart, for example Host CPU Usage and select
 and then Open in Chart Builder.
 - In the text box, remove the where entityName=$HOSTID clause and click Build Chart.
- In the Facets list, click hostname to compare the values across hosts.
- Configure the time scale, minimums and maximums, and dimension. For example:
- How do I compare all disk IO for all the DataNodes that belong to a specific HDFS service?
- Use a query of the form:
select bytes_read, bytes_written where roleType=DATANODE and serviceName=hdfs1
replacing hdfs1 with your HDFS service name. Then facet by metricDisplayName and compare all DataNode byte_reads and byte_writes metrics at once. See Grouping (Faceting) Time Series for more details about faceting. - When would I use a derivative function?
- Some metrics represent a counter, for example, bytes_read. For such metrics it is sometimes useful to see the rate of change instead of the absolute counter value. Use dt or dt0 derivative functions.
- When should I use the dt0 function?
- Some metrics, like bytes_read represent a counter that always grows. For such metrics a negative rate means that the counter has been reset (for example, process restarted, host restarted, and so on). Use dt0 for these metrics.
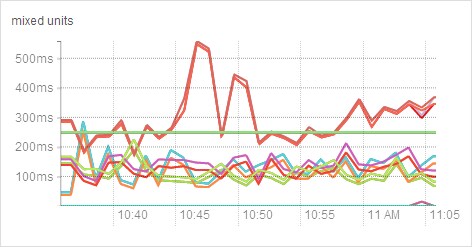
- How do I display a threshold on a chart?
- Suppose that you want to retrieve the latencies for all disks on your hosts, compare them, and show a threshold on the chart to easily detect outliers. Use the following query to
retrieve the metrics and the threshold:
select await_time, await_read_time, await_write_time, 250 where category=disk
Then choose All Combined (1) in the Facets list. The scalar threshold 250 will also be rendered on the chart:
See Grouping (Faceting) Time Series for more details about faceting. - I get the warning "The query hit the maximum results limit". How do I work around the limit?
- There is a limit on the number of results that can be returned by a query. When a query results in more time-series streams than the limit a warning for "partial results" is issued. To
circumvent the problem, reduce the number of metrics you are trying to retrieve or see Configuring Time-Series Query
Results.
You can use the rlike operator to limit the query to a subset of entities. For example, instead ofyou can use
select await_time, await_read_time, await_write_time, 250 where category=DISK
select await_time, await_read_time, await_write_time, 250 where category=DISK and hostname rlike "host1[0-9]?.cloudera.com"
The latter query retrieves the disk metrics for ten hosts. - How do I discover which metrics are available for which entities?
-
- Type Select in the text box and then press Space or continue typing. Metrics matching the letters you type display in a drop-down list.
- Select , click the question mark icon
 to the right of the Build Chart button and click the List of
Metrics link
to the right of the Build Chart button and click the List of
Metrics link - Retrieve all metrics for the type of entity:
select * where roleType=DATANODE