Using the Multi Cloudera Manager Status Dashboard
Use the Multi Cloudera Manager Status Dashboard Status page to monitor the CDH clusters managed by the Cloudera Manager instancess you have added to the Multi Cloudera Manager Dashboard. The Status tab displays a table with rows that contain information about each cluster. Within each row, you can click links to display additional information and go to the relevant Cloudera Manager, cluster, or service.
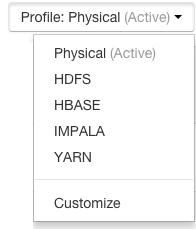
You configure which columns display by creating Profiles. The name of the active profile displays in a button on the
right of the screen above the table of Cloudera Managers. You can choose which profile is active by clicking ![]() next to the profile name and selecting a new profile.
next to the profile name and selecting a new profile.
In a profile, you can also select Metrics, which are queries that display metrics about the functionality of each cluster. A set of metrics are provided, and you can create custom metrics using the tsquery Language.
Using the Filters section, you can limit the rows displayed by selecting various values of the displayed columns. You can define which columns are used as filters in the profile.
Multi Cloudera Manager Status Dashboard Columns
| Column | Description |
|---|---|
| Status | Displays an icon representing the health of the cluster. See Health Status Icons. |
| Cluster Name | Displays the cluster name and the Cloudera Manager that manages it; for example:
Cluster 1 / Sales The cluster name is a link that you can click to display a pop-up box containing additional information about the cluster. The pop-up includes the following links:
The Cluster Name column also displays the latest time that data was fetched from the Cloudera Manager and displays text indicating the health status of the Cloudera Management Service for the cluster. |
| Services | Displays icons indicating the health status of each service defined in the cluster. See Health Status Icons.
Click the service name to open a pop-up box that displays details about the service's status. Click Visit Service to go to the service page in the Cloudera Manager instance that manages that service. Healthy services are hidden by default. Click the Show healthy services(#) link to show the list of services. Click Hide healthy services to hide them. |
| Hosts | Displays colored badges displaying the number of hosts in the cluster by their health status. For example:
 Click the badge to go to the Hosts page of the Cloudera Manager instance that manages the cluster. |
| CM Version | Displays the version of the Cloudera Manager instance. |
| Cloudera Management Service Status | Displays icons indicating the health status of the Cloudera Management Service. See Health Status Icons. |
| Host Count | Number of hosts in the cluster. |
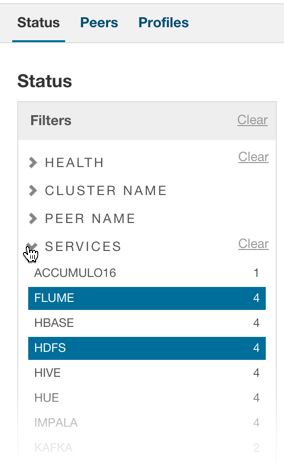
Filtering the Status Display
Click the ![]() icon next to an item in the Filters section to
see the values you can select for filtering. By selecting one or more items, you can limit the rows displayed to those that match the values you select. You can select multiple values for multiple
items.
icon next to an item in the Filters section to
see the values you can select for filtering. By selecting one or more items, you can limit the rows displayed to those that match the values you select. You can select multiple values for multiple
items.
Click the Clear link to remove the filter.
Multi Cloudera Manager Status Dashboard Metrics
The Multi Cloudera Manager Dashboard has a number of default queries you can use to display metrics. You select which metrics display by defining a Profile. See Installing and Managing the Multi Cloudera Manager Dashboard. You can also create custom queries by using the tsquery Language to write queries on data from the Cloudera Manager time-series datastore. See Adding a Custom Metric.
Health Status Icons
|


