Directory Usage Report
The directory usage report allows you to browse the HDFS filesystem in a way that is similar to the HDFS File Browser . However, the Directory Usage Report also allows you to sort the listings and select multiple items and perform actions on them. You can also view the last access time, the last modified time of any file in a directory, and the total size of all files in the directory. This usage information is updated on an hourly basis.
You can customize the report by adding filters. A number of preconfigured filters are available, and you can create a custom filter.
Accessing the Directory Usage Report
To view the directory usage report, click .
You can also access this report from the HDFS File Browser. (To access the File Browser, click .) Click the Directory Usage link located in the lower-right portion of the File Browser.
Using the Directory Usage Report
When you first open the report, the top level of the HDFS filesystem displays:
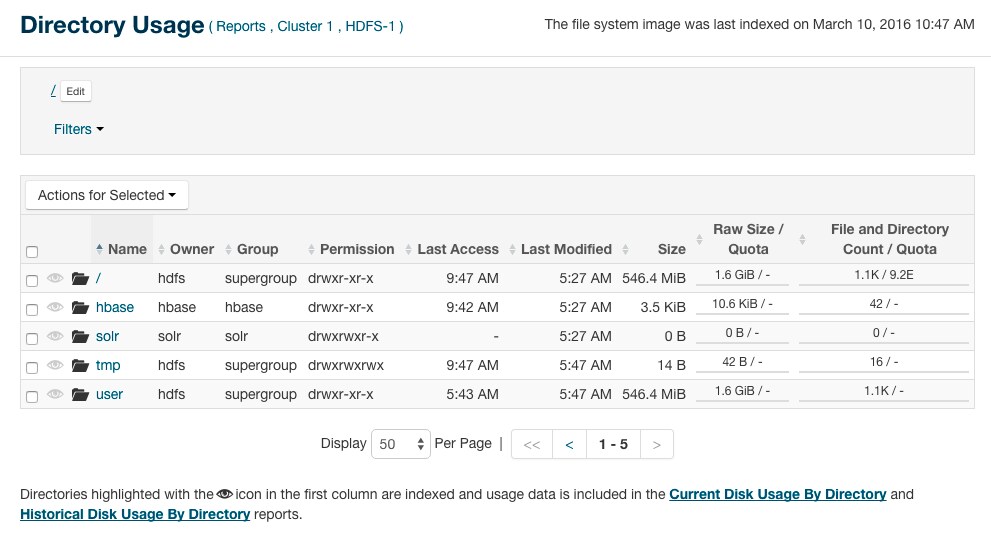
Click the Reports link next to the Directory Usage title to go back to the Reports menu. You can also click links to go to the cluster and HDFS service home pages.
Click any column header to sort the display.
Click a directory name to view the files and subdirectories in the directory.
- Manage Quota – A dialog box opens in which you can set a quota for the number of files or disk space. These values are displayed in columns in the file listing.
- Include selected directories in disk usage reports – The selected directories appear in the Disk Usage Reports.
- Exclude selected directories from disk usage reports – The selected directories do not appear in the Disk Usage Reports.
Filters
- Large Files
- Large Directories
- By Specific Owner
- By Specific Group
- Old Files
- Old Directories
- Files with Low Replication
- Overpopulated Directories
- Directories with Quotas
- Directories Watched
Click the Search button to display the report with the filters applied.
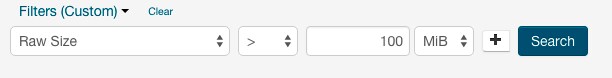
- Select any of the following criteria from the drop-down menu on the left:
- Filename
- Owner
- Group
- Path
- Last Modified
- Size
- Diskspace Quota
- Namespace Quota
- Last Access
- File and Directory Count
- Replication
- Parent
- Raw Size
- Select an operator from the drop-down menu.
- Enter a value and units of measure for the comparison.
- Select the units of measure for the comparison from the drop-down menu. (Some criteria do not require units of measure.)
- Click the
 icon to add additional criteria.
 - Click the Search button to display the directory usage report with the custom filter applied.
The report changes to display the result of applying the filter. A new column, Parent is added that contains the full path to each file or subdirectory.
Disk Usage Reports
There are two types of disk usage reports: Current Disk Usage By Directory and Historical Disk Usage By Directory. To
use these reports, select one or more directories to watch by clicking the  icon for the directory.
You can also select multiple directories, and then click .
icon for the directory.
You can also select multiple directories, and then click .
For information on using and configuring the Disk Usage Report, see Disk Usage Reports.