Monitoring Spark Applications
To obtain information about Spark application behavior you can consult cluster manager logs and the Spark web application UI. These two methods provide complementary information. Logs enable you to see fine grained events in the lifecycle of an application. The web UI provides both a broad overview of the various aspects of Spark application behavior and fine grained metrics. This section provides an overview of both methods.
For further information on Spark monitoring, see Monitoring and Instrumentation.
Viewing and Debugging Spark Applications Using Logs
- YARN - Go to the YARN applications page in the Cloudera Manager Admin Console.
To debug Spark applications running on YARN, view the logs for the NodeManager role:
- Open the log event viewer.
- Filter the event stream to choose a time window, log level, and display the NodeManager source.
- For any event, click View Log File to view the entire log file.
- Spark Standalone - Go to the Spark Master UI, by default at http://spark_master:18080. The master and each worker show cluster and job statistics. In addition, detailed log output for each job is also written to the work directory of each worker.
Visualizing Spark Applications Using the Web Application UI
Every Spark application launches a web application UI that displays useful information about the application:
- An event timeline that displays the relative ordering and interleaving of application events. The timeline view is available on three levels: across all jobs, within one job, and within one stage. The timeline also shows executor allocation and deallocation.
- A list of stages and tasks.
- The execution directed acyclic graph (DAG) for each job.
- A summary of RDD sizes and memory usage.
- Environment - runtime information, property settings, library paths.
- Information about Spark SQL jobs.
The web UI is available in different ways depending on whether the application is running or has completed.
Continue reading:
Accessing the Web UI of a Running Spark Application
To access the web application UI of a running Spark application, open http://spark_driver_host:4040 in a web browser. If multiple applications are running on the same host, the web application binds to successive ports beginning with 4040 (4041, 4042, and so on). The web application is available only for the duration of the application.
Accessing the Web UI of a Completed Spark Application
To access the web application UI of a completed Spark application, do the following:
- Open the Spark History Server UI in one of the following ways:
- Open the URL http://spark_history_server_host:18088.
- Open the UI in the Cloudera Manager Admin Console:
- Go to the Spark service.
- Click the History Server Web UI link.
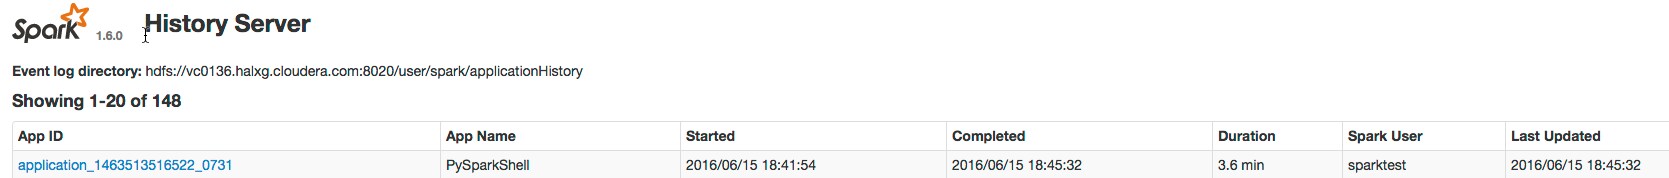
- In the list of applications, click an App ID link. The application UI displays.
Example Spark Application Web Application
Consider a job consisting of a set of transformation to join data from an accounts dataset with a weblogs dataset in order to determine the total number of web hits for every account and then an action write the result to HDFS. In this example, the write is performed twice, resulting in two jobs. To view the application UI, in the History Server click the link in the App ID column:
The following screenshot shows the timeline of the events in the application including the jobs that were run and the allocation and deallocation of executors. Each job shows the last action, saveAsTextFile, run for the job. The timeline shows that the application acquires executors over the course of running the first job. After the second job finishes, the executors become idle and are returned to the cluster.
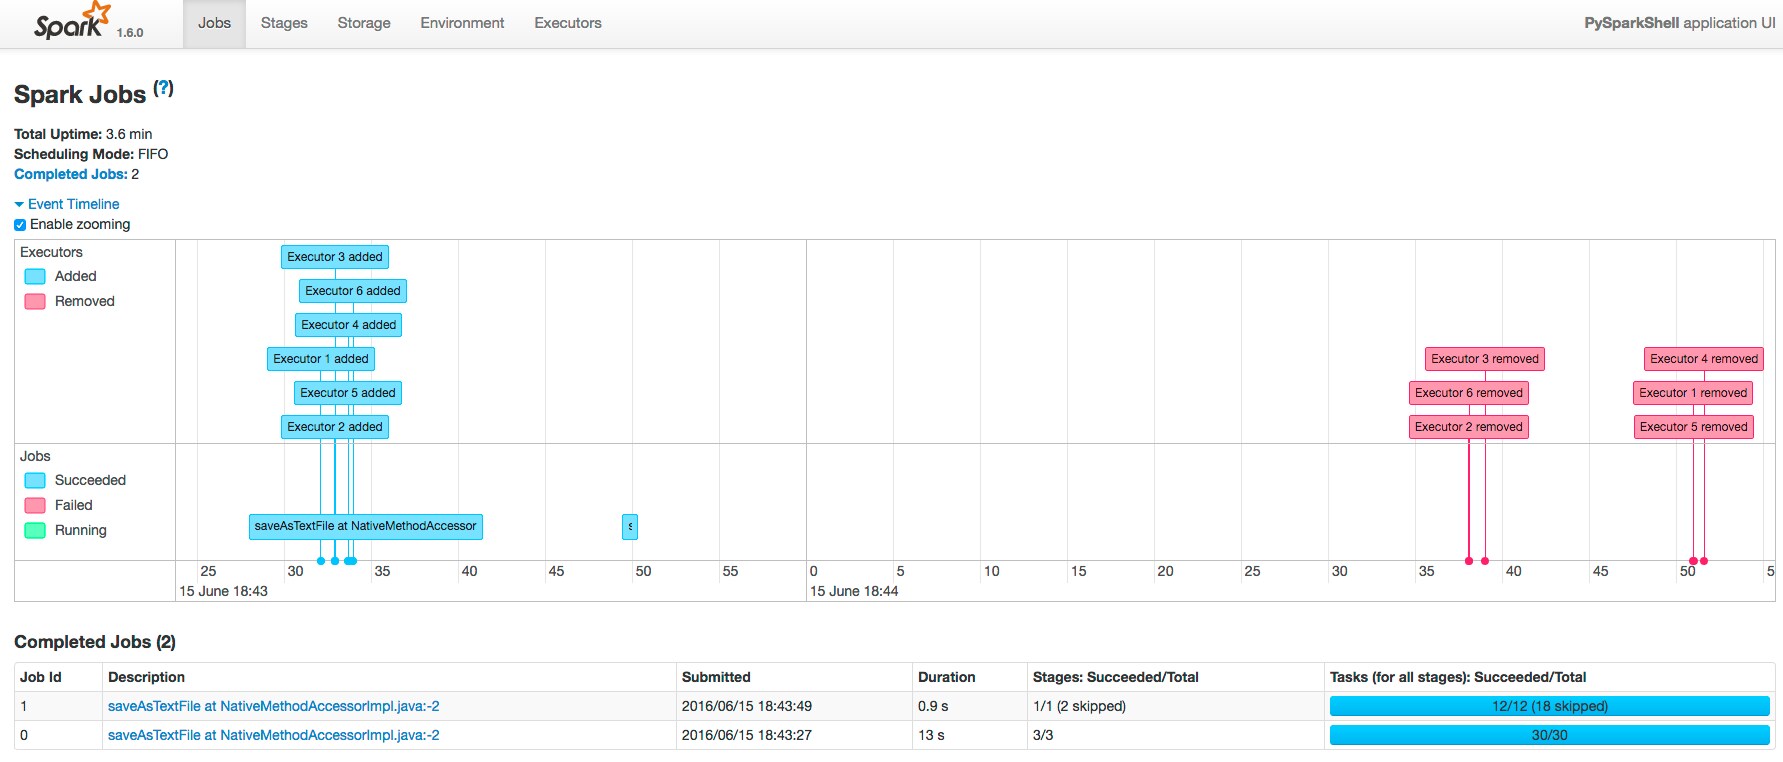
- Pan - Press and hold the left mouse button and swipe left and right.
- Zoom - Select the Enable zooming checkbox and scroll the mouse up and down.
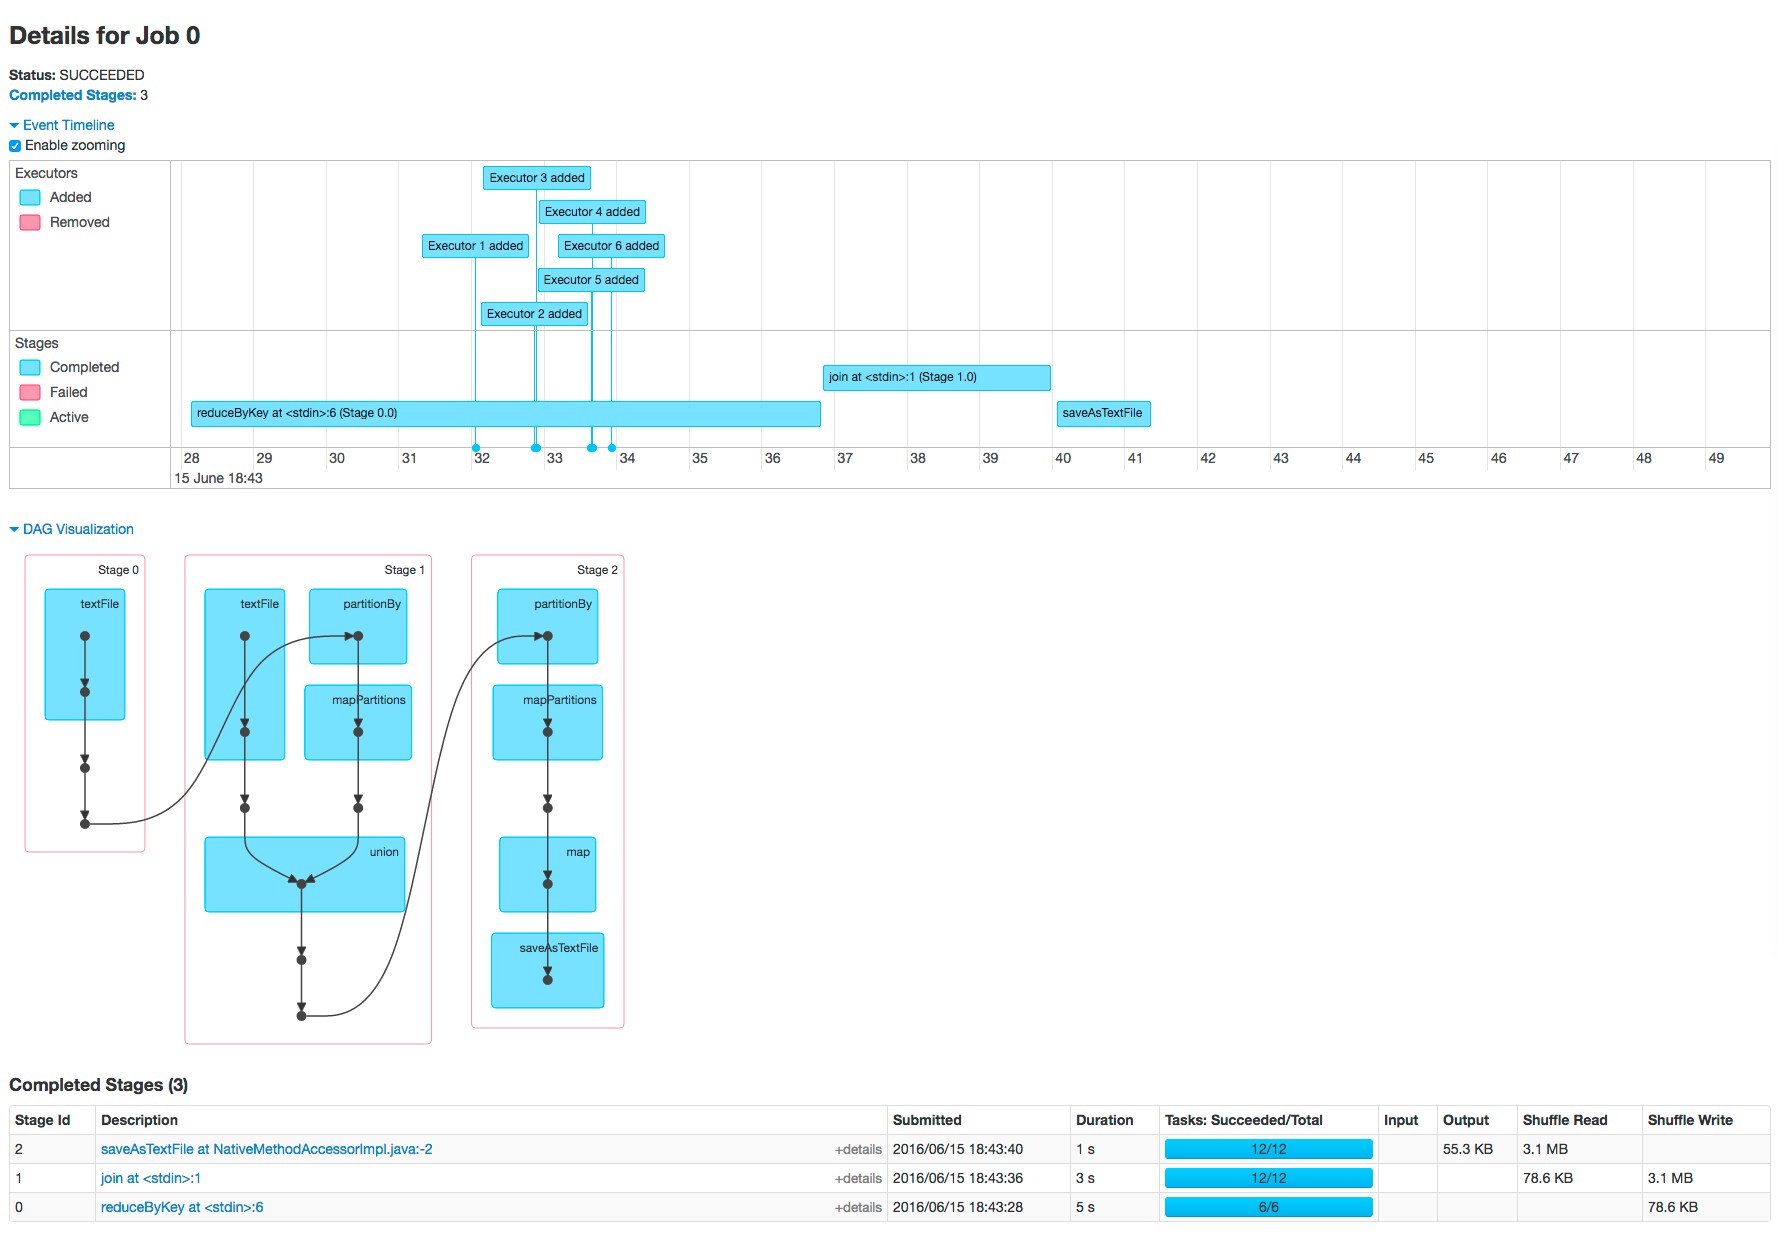
To view the details for Job 0, click the link in the Description column. The following screenshot shows details of each stage in Job 0 and the DAG visualization. Zooming in shows finer detail for the segment from 28 to 42 seconds:
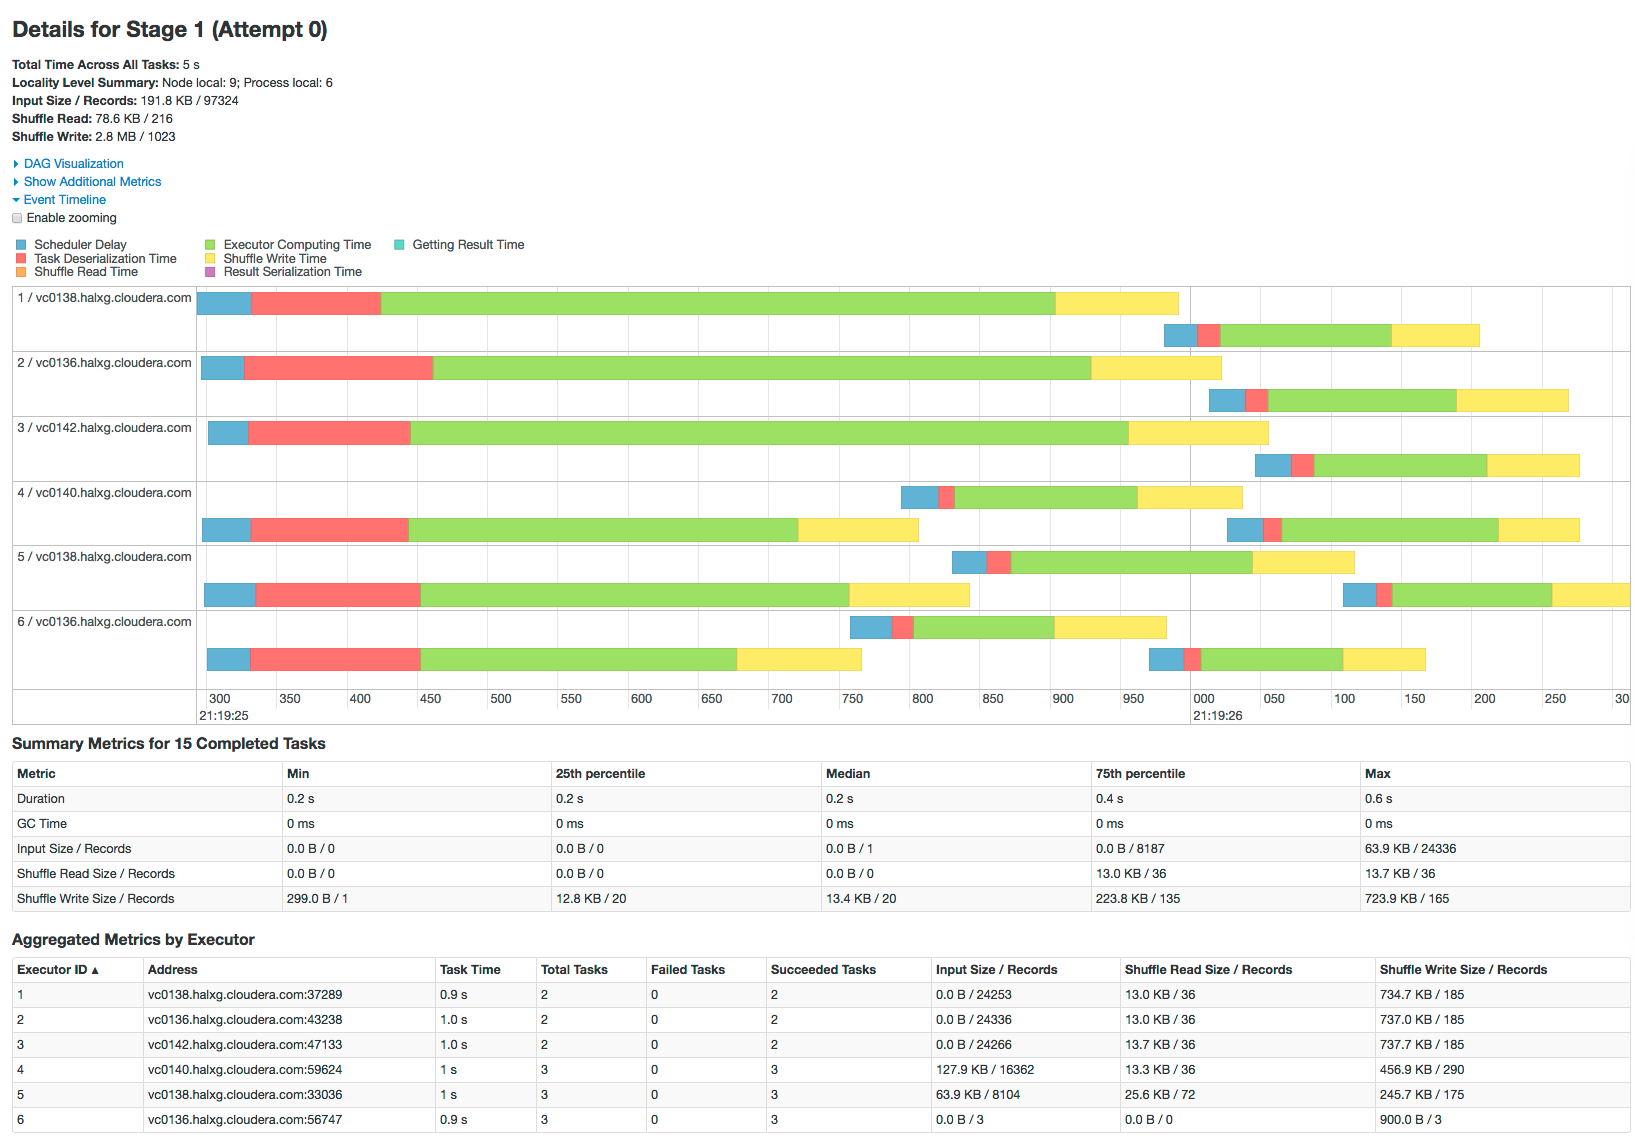
Clicking a stage shows further details and metrics:
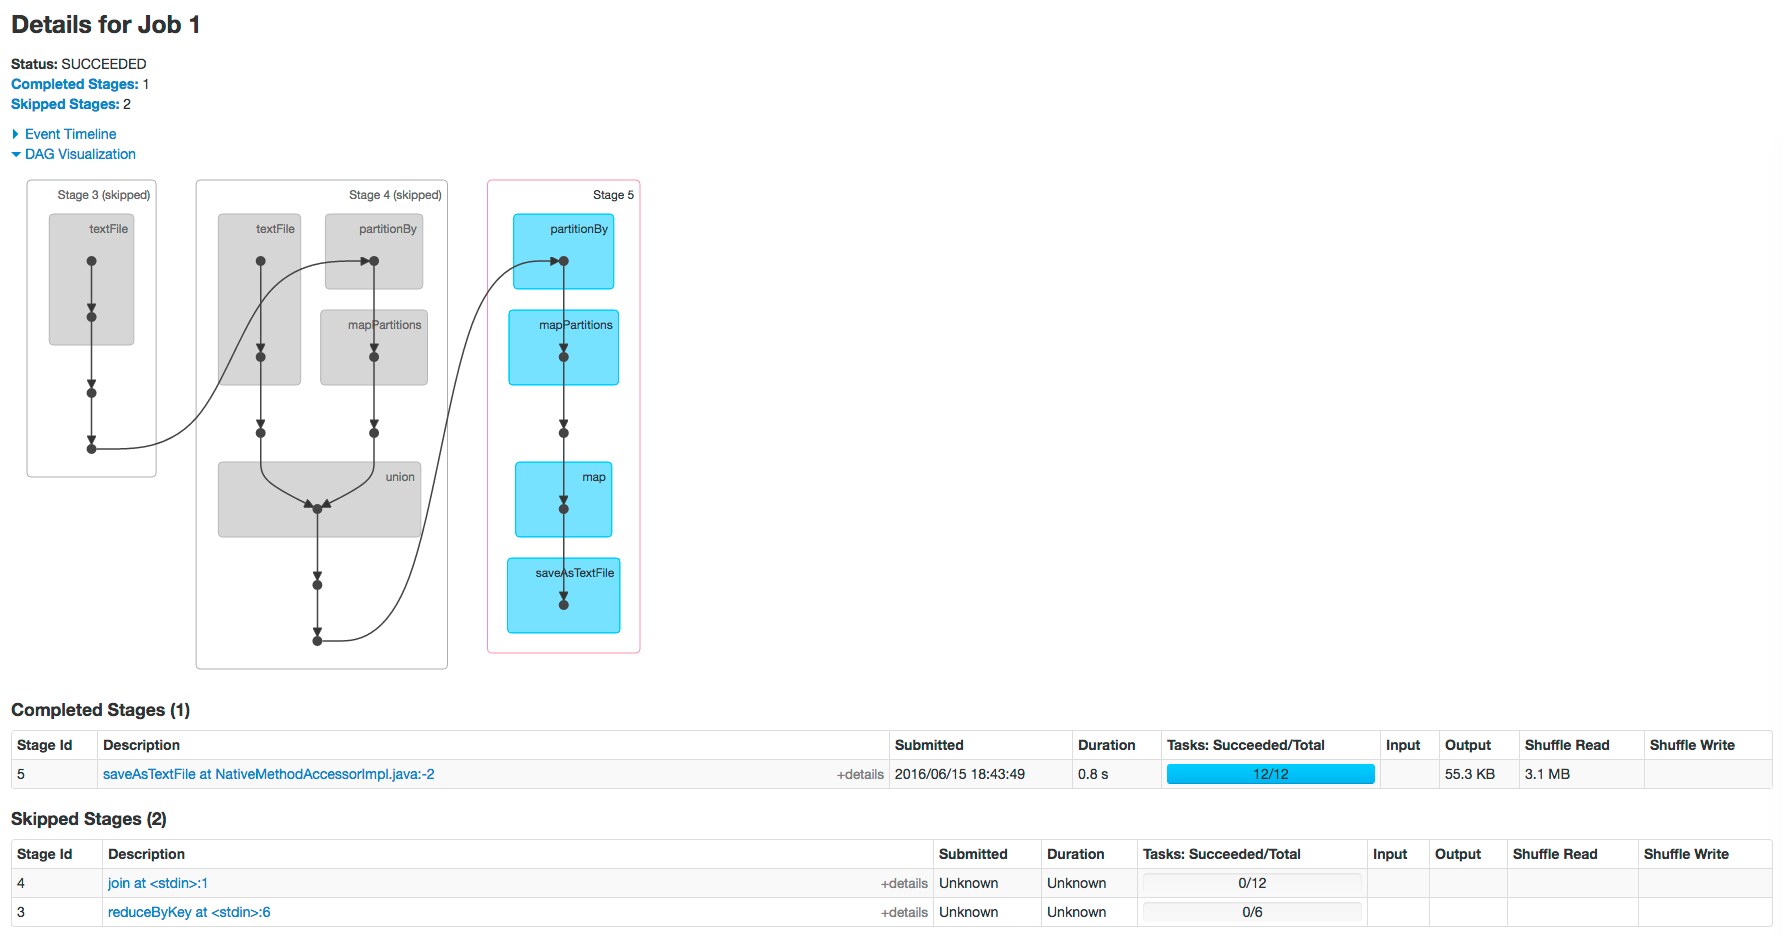
The web page for Job 1 shows how preceding stages are skipped because Spark retains the results from those stages:
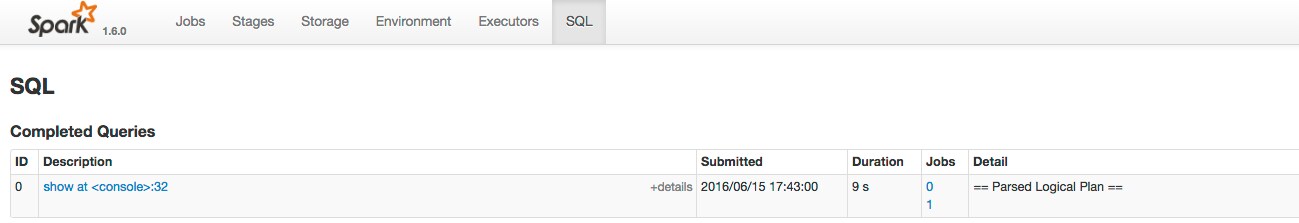
Example Spark SQL Web Application
In addition to the screens described above, the web application UI of an application that uses the Spark SQL API also has an SQL tab. Consider an application that loads the contents of two tables into a pair of DataFrames, joins the tables, and then shows the result. After you click the application ID, the SQL tab displays the final action in the query:
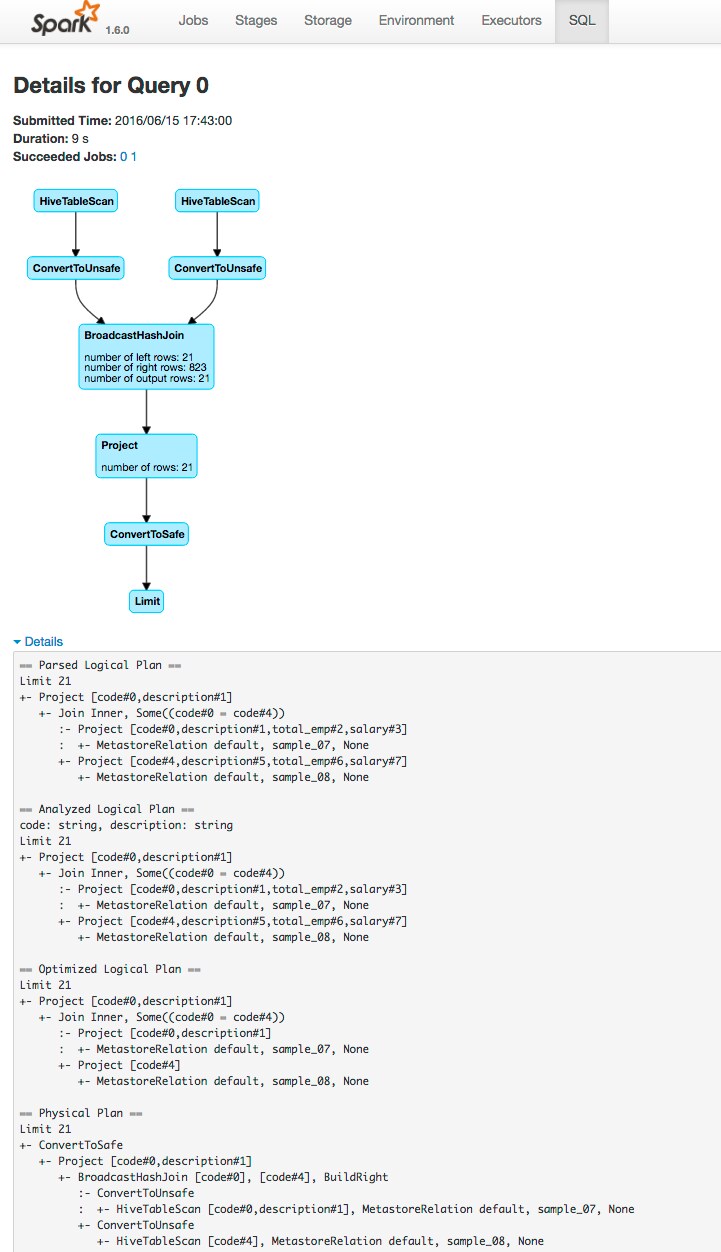
If you click the show link you see the DAG of the job. Clicking the Details link on this page displays the logical query plan:
Example Spark Streaming Web Application
The Spark driver web application UI also supports displaying the behavior of streaming applications in the Streaming tab. If you run the example described in Spark Streaming Example, and provide three bursts of data, the top of the tab displays a series of visualizations of the statistics summarizing the overall behavior of the streaming application:
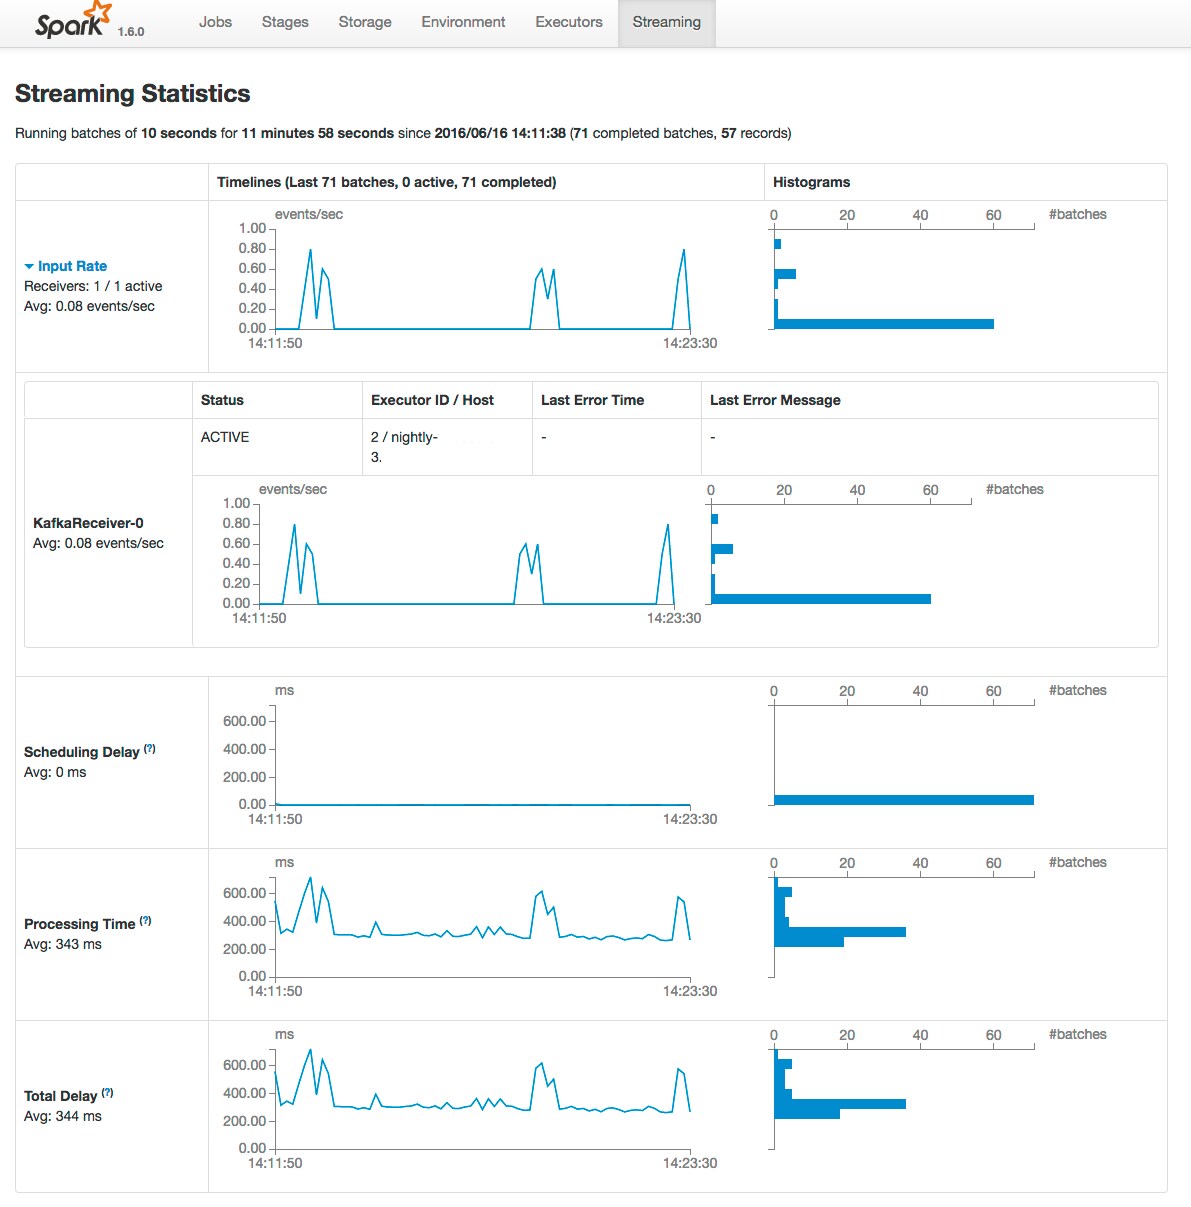
The application has one receiver that processed 3 bursts of event batches, which can be observed in the events, processing time, and delay graphs. Further down the page you can view details of individual batches:
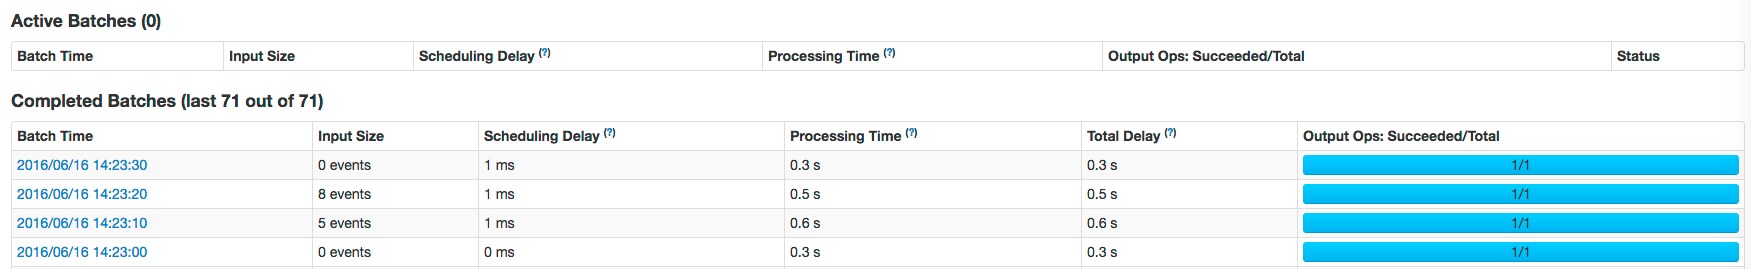
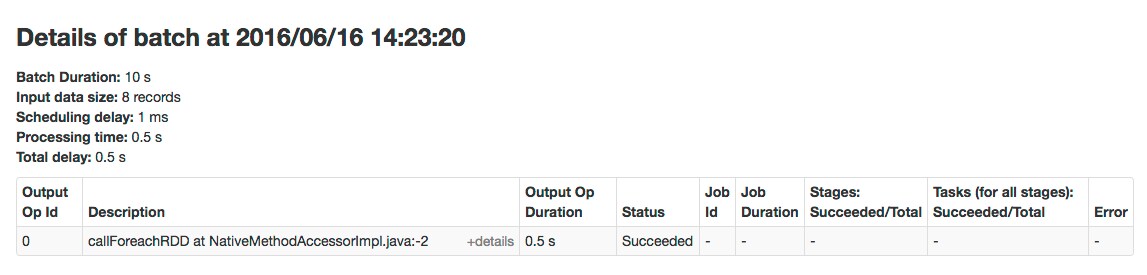
To view the details of a specific batch, click a link in the Batch Time column. Clicking the 2016/06/16 14:23:20 link with 8 events in the batch, provides the following details: