Monitoring the Performance of Hive Replications
You can monitor the progress of a Hive replication schedule using performance data that you download as a CSV file from the Cloudera Manager Admin console. This file contains information about the tables and partitions being replicated, the average throughput, and other details that can help diagnose performance issues during Hive replications. You can view this performance data for running Hive replication jobs and for completed jobs.
- Go to .
- Locate the row for the schedule.
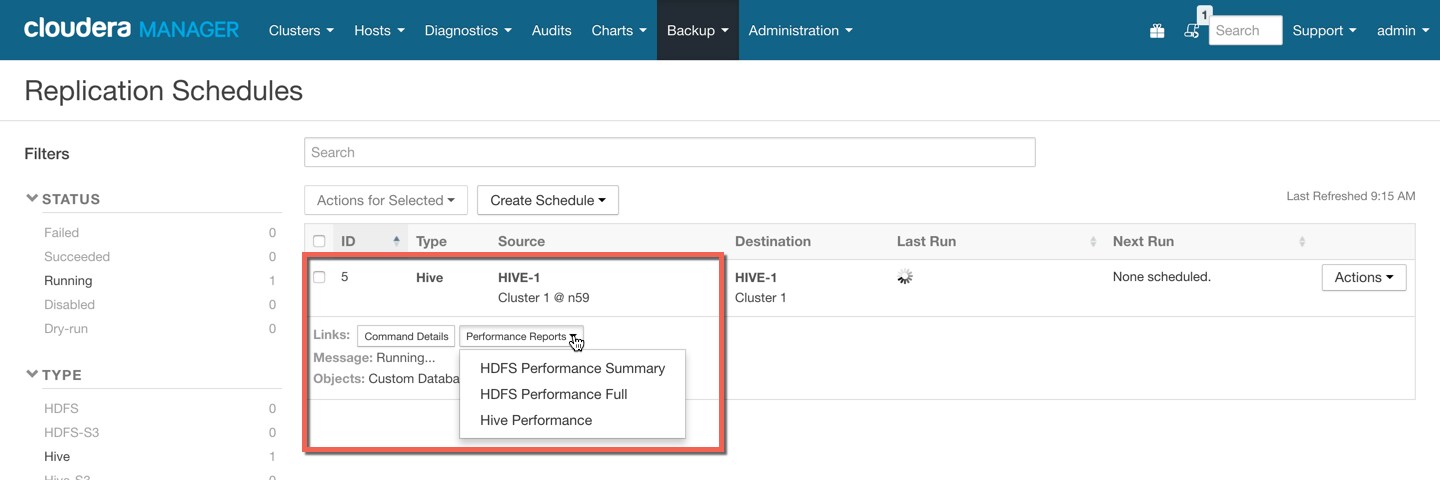
- Click Performance Reports and select one of the following options:
- HDFS Performance Summary – downloads a summary performance report of the HDFS phase of the running Hive replication job.
- HDFS Performance Full – downloads a full performance report of the HDFS phase of the running Hive replication job.
- Hive Performance – downloads a report of Hive performance.
- To view the data, import the file into a spreadsheet program such as Microsoft Excel.
- Go to .
- Locate the schedule and click .
The Replication History page for the replication schedule displays.
- Click
 to expand the display of the selected schedule.
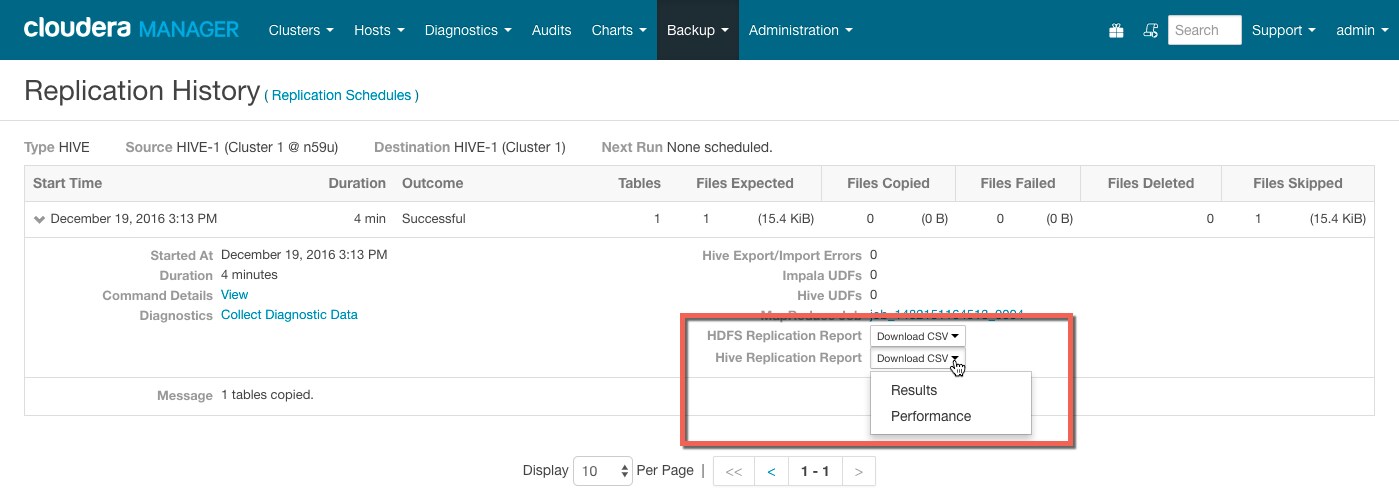
 - To view performance of the Hive phase, click Download CSV next to the Hive Replication Report label and select one
of the following options:
- Results – download a listing of replicated tables.
- Performance – download a performance report for the Hive replication.
See Hive Performance Report Columns for a description of the data in the HDFS performance reports.
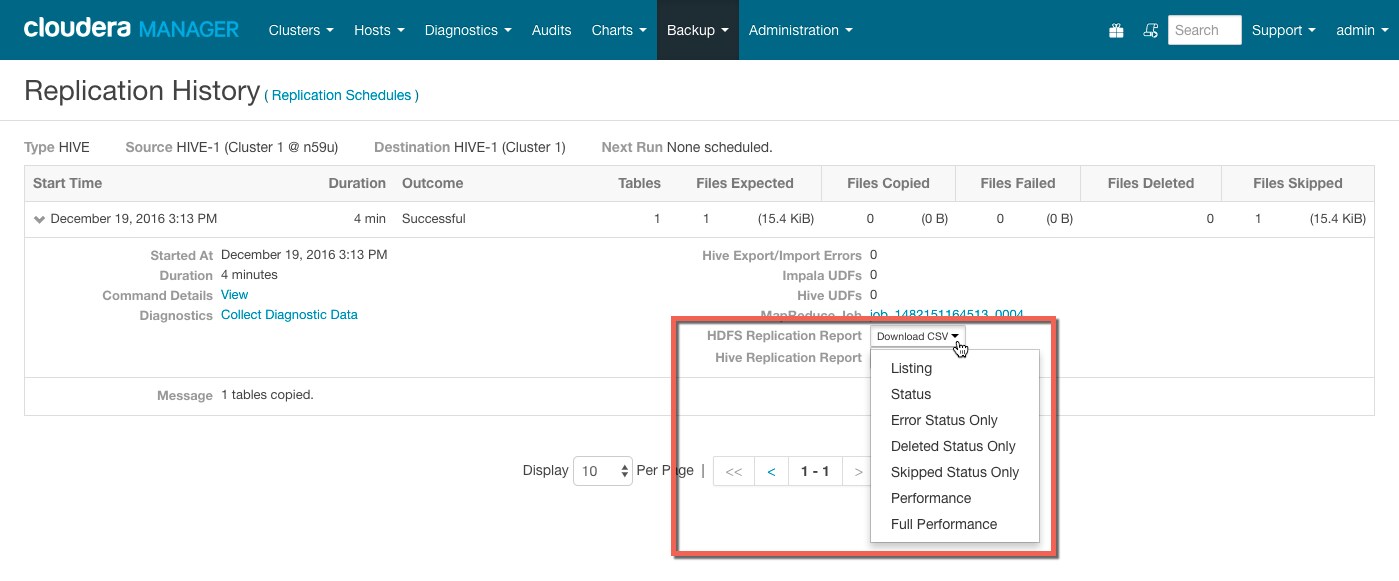
- To view performance of the HDFS phase, click Download CSV next to the HDFS Replication Report label and select one
of the following options:
- Listing – a list of files and directories copied during the replication job.
- Status - full status report of files where the status of the replication is one of the following:
- ERROR – An error occurred and the file was not copied.
- DELETED – A deleted file.
- SKIPPED – A file where the replication was skipped because it was up-to-date.
- Error Status Only – full status report, filtered to show files with errors only.
- Deleted Status Only – full status report, filtered to show deleted files only.
- Skipped Status Only– full status report, filtered to show skipped files only.
- Performance – summary performance report.
- Full Performance – full performance report.
See HDFS Performance Report Columns for a description of the data in the HDFS performance reports.
- To view the data, import the file into a spreadsheet program such as Microsoft Excel.
The performance data is collected every two minutes. Therefore, no data is available during the initial execution of a replication job because not enough samples are available to estimate throughput and other reported data.
| Hive Performance Data Columns | Description |
|---|---|
| Timestamp | Time when the performance data was collected |
| Host | Name of the host where the YARN or MapReduce job was running. |
| DbName | Name of the database. |
| TableName | Name of the table. |
| TotalElapsedTimeSecs | Number of seconds elapsed from the start of the copy operation. |
| TotalTableCount | Total number of tables to be copied.
The value of the column will be -1 for replications where Cloudera Manager cannot determine the number of tables being changed. |
| TotalPartitionCount | Total number of partitions to be copied.
If the source cluster is running Cloudera Manager 5.9 or lower, this column contains a value of -1 because older releases do not report this information. |
| DbCount | Current number of databases copied. |
| DbErrorCount | Number of failed database copy operations. |
| TableCount | Total number of tables (for all databases) copied so far. |
| CurrentTableCount | Total number of tables copied for current database. |
| TableErrorCount | Total number of failed table copy operations. |
| PartitionCount | Total number of partitions copied so far (for all tables). |
| CurrPartitionCount | Total number of partitions copied for the current table. |
| PartitionSkippedCount | Number of partitions skipped because they were copied in the previous run of the replication job. |
| IndexCount | Total number of index files copied (for all databases). |
| CurrIndexCount | Total number of index files copied for the current database. |
| IndexSkippedCount | Number of Index files skipped because they were not altered.
Due to a bug in Hive, this value is always zero. |
| HiveFunctionCount | Number of Hive functions copied. |
| ImpalaObjectCount | Number of Impala objects copied. |
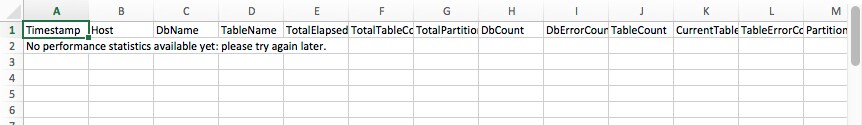
A sample CSV file, as presented in Excel, is shown here:

- If you click the CSV download too soon after the replication job starts, Cloudera Manager returns an empty file or a CSV file that has columns headers only and a message to try later
when performance data has actually been collected.
- If you employ a proxy user with the form user@domain, performance data is not available through the links.
- If the replication job only replicates small files that can be transferred in less than a few minutes, no performance statistics are collected.
- For replication schedules that specify the Dynamic Replication Strategy, statistics regarding the last file transferred by a MapReduce job hide previous transfers performed by that MapReduce job.
- Only the last trace of each MapReduce job is reported in the CSV file.