Cloudera Navigator Lineage Diagrams
Minimum Required Role: Lineage Administrator (also provided by Metadata Administrator, Full Administrator)
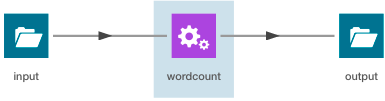
Cloudera Navigator provides an automatic collection and easy visualization of upstream and downstream data lineage to verify reliability. For each data source, it shows, down to the column level within that data source, what the precise upstream data sources were, the transforms performed to produce it, and the impact that data has on downstream artifacts.
A lineage diagram is a directed graph that depicts an extracted entity and its relations with other entities. A lineage diagram is limited to 400 entities. Once that limit is reached, certain entities display as a "hidden" icon.
Entities
| HDFS | Pig | ||
|
|
|
|
| Hive and Impala | Spark (Unsupported and disabled by default. To enable, see Enabling and Disabling Metadata Extraction.) | ||
|
|
|
|
| MapReduce and YARN | Sqoop | ||
|
|
|
|
| Oozie | S3 | ||
|
|
|
|
| Hidden | |||
|
|
See Viewing the Lineage of Hidden Entities. | ||


 :
:
- The entity has not yet been extracted. In this case, is eventually replaced with the correct
entity icon after the entity is extracted and linked in Navigator. For information on how long it takes for newly created entities to be extracted, see Metadata Extraction.
- A Hive entity has been deleted from the system before it could be extracted.
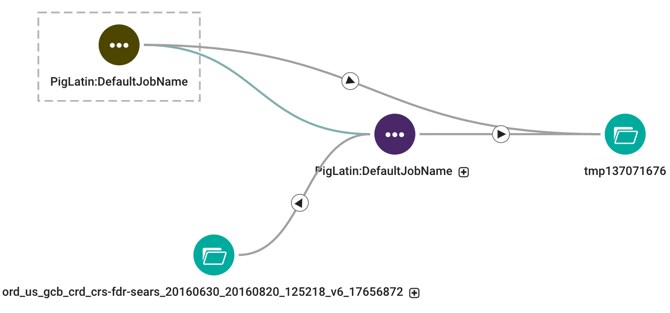
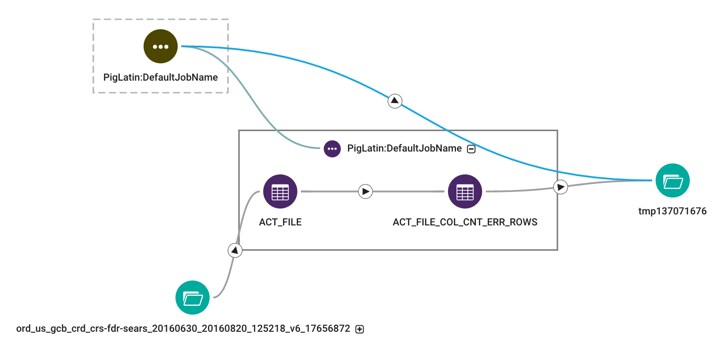
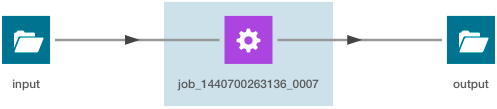
The following lineage diagram illustrates the relations between the YARN operation DefaultJobName and Pig script DefaultJobNameand the source file in the ord_us_gcb_crd_crs-fdr-sears folder and destination folder tmp137071676:
Relations
Relations between the entities are represented graphically by lines, with arrows indicating the direction of the data flow. Navigator supports the following types of relations:
| Relation Type | Description |
|---|---|
| Data flow | Describes a relation between data and a processing activity; for example, between a file and a MapReduce job or vice versa. |
| Parent-child | Describes a parent-child relation. For example, between a directory and a file. |
| Logical-physical | Describes the relation between a logical entity and its physical entity. For example, between a Hive query and a MapReduce job. |
| Instance of | Describes the relation between a template and its instance. For example, an operation execution is an instance of operation. Instance of relations are never visualized in the lineage, however you can navigate between template and instance lineage diagrams. See Displaying an Instance Lineage Diagram and Displaying the Template Lineage Diagram for an Instance Lineage Diagram. |
| Control flow | Describes a relation where the source entity controls the data flow of the target entity. For example, between the columns used in an insert clause and the where clause of a Hive query. |
- Solid (
 ) represents a "data flow" relationship, indicating that the columns appear
(possibly transformed) in the output (when directional with arrow) and "logical- physical" (when no arrow). For example, a solid line appears between the columns used in a select clause.
) represents a "data flow" relationship, indicating that the columns appear
(possibly transformed) in the output (when directional with arrow) and "logical- physical" (when no arrow). For example, a solid line appears between the columns used in a select clause. - Dashed (
 ) represents a "control flow" relationship, indicating that the columns
determine which rows flow to the output. For example, a dashed line appears between the columns used in an insert or select clause and
the where clause of a Hive query. Control flow lines are hidden by default. See Filtering Lineage Diagrams.
) represents a "control flow" relationship, indicating that the columns
determine which rows flow to the output. For example, a dashed line appears between the columns used in an insert or select clause and
the where clause of a Hive query. Control flow lines are hidden by default. See Filtering Lineage Diagrams. - Blue (
 ) represents a selected link.
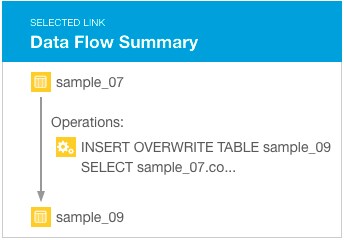
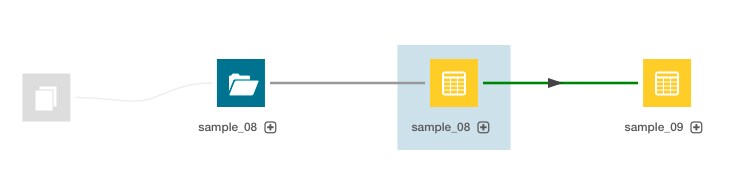
 - Green (
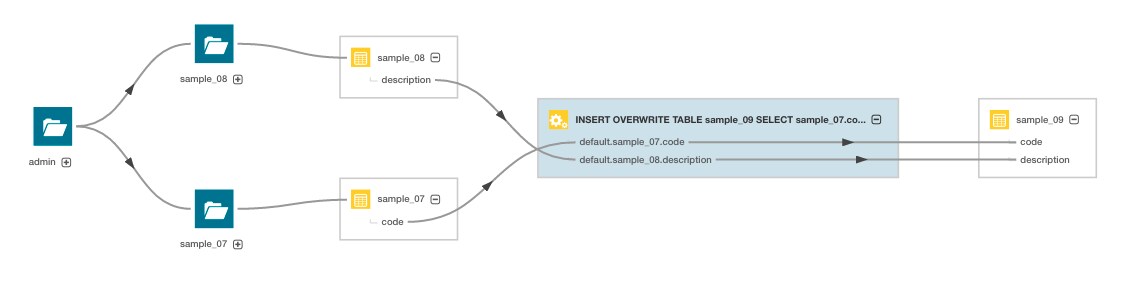
 ) represents a summary link that contains operations. When you click the link,
the link turns blue (for selected) and the nested operations display in the selected link summary:
) represents a summary link that contains operations. When you click the link,
the link turns blue (for selected) and the nested operations display in the selected link summary:
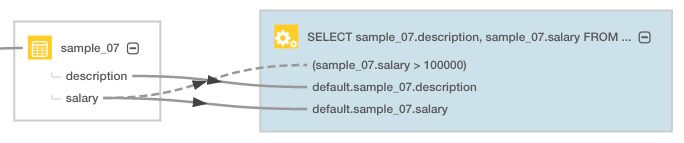
SELECT sample_07.description,sample_07.salary FROM sample_07
WHERE ( sample_07.salary > 100000)
ORDER BY sample_07.salary DESC LIMIT 1000
has solid, directed lines between the columns in the select clause and a dashed line between the columns in the where clause:
Manipulating Lineage Diagrams
Expanding Entities
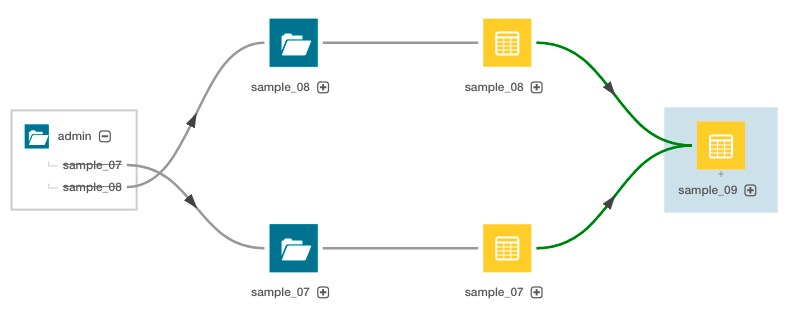
You can click a  icon in a parent entity to display its child entities. For example, you can
click an Oozie job to display its child Pig script and the Pig script to display its child tables:
icon in a parent entity to display its child entities. For example, you can
click an Oozie job to display its child Pig script and the Pig script to display its child tables:
Modifying Lineage Layout
- To improve the layout of a lineage diagram, you can drag entities (like tmp137071676) located outside a parent box.
- Use the mouse scroll wheel or the

control to zoom the lineage diagram in and out. - You can move an entire lineage diagram in the lineage pane by pressing the mouse button and dragging it.
Viewing the Lineage of Hidden Entities
Lineage that is not fully traversed (that is, you do not see a subset of the actual lineage) is illustrated by the
icon. This icon displays when the lineage diagram has more than 400 entities. For example:
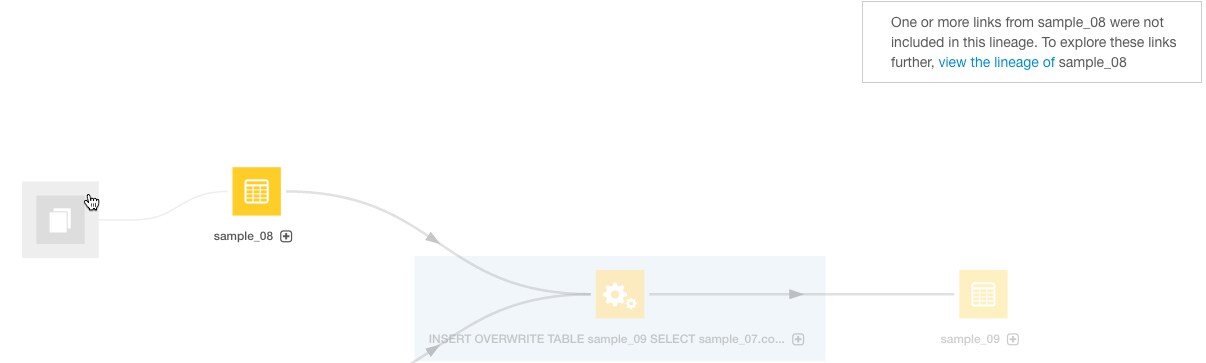
To view the lineage of hidden entities, select the hidden entity and click view the lineage in the box on the right to display a new lineage centered around that entity. After clicking the link, you would see the following:
Filtering Lineage Diagrams
To reduce the time and resources required to render large lineage diagrams, you can filter out classes of entities and links by selecting checkboxes in the Lineage Options box on the right of the diagram. The following are the default selections: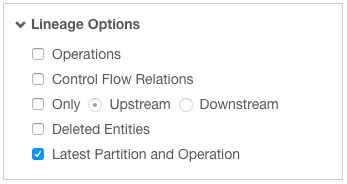
The Only Upstream/Downstream filter allows you to filter out entities and links that are input (upstream) to and output (downstream) from another entity.
Use the Latest Partition and Operation filter to reduce rendering time when you have similar partitions created and operations performed periodically. For example, if Hive partitions are created daily, the filter allows you to display only the latest partition.
Filter Example
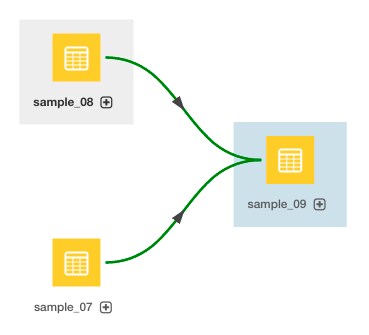
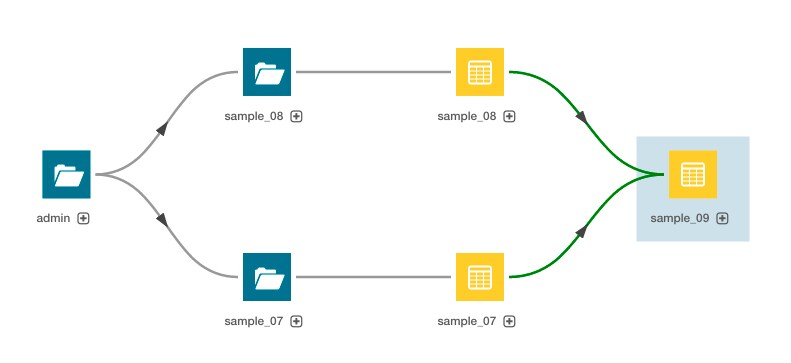
If you display the lineage of the sample_09 table with no filtering options selected (other than hiding deleted items), the lineage appears as follows.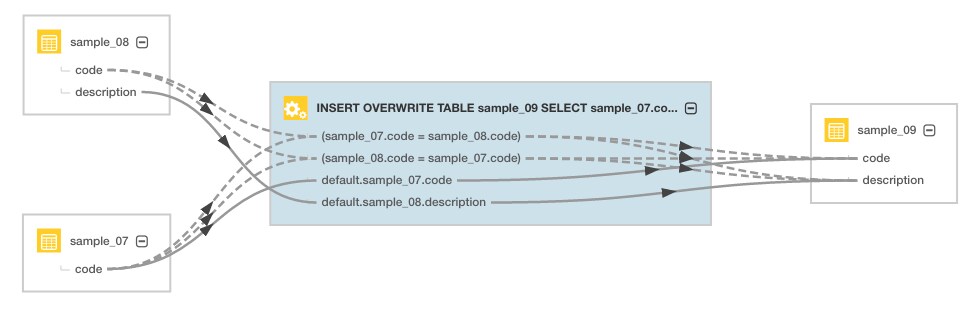
Subsequent diagrams show the result of using each supported filter type:
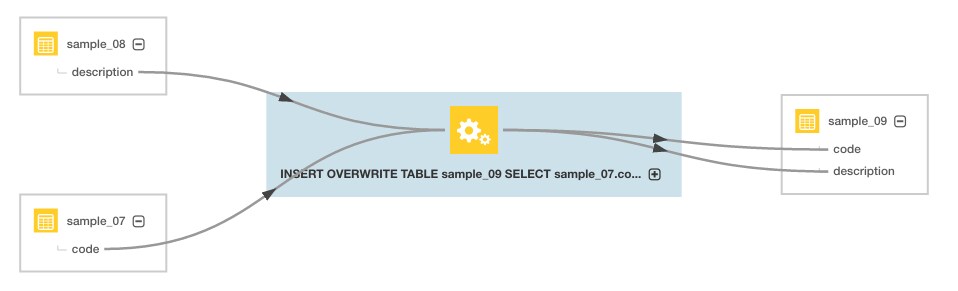
- Control Flow Relations - The operation is collapsed and control flow links are hidden.
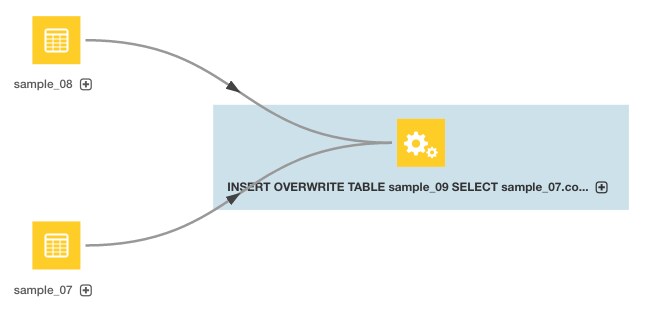
- Show Upstream and Show Downstream - The operation is collapsed and only upstream entities and links are shown. The
output table is hidden.
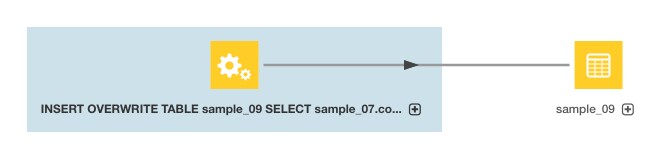
Here, the operation is collapsed and only downstream entities and links are shown. The input tables are hidden.
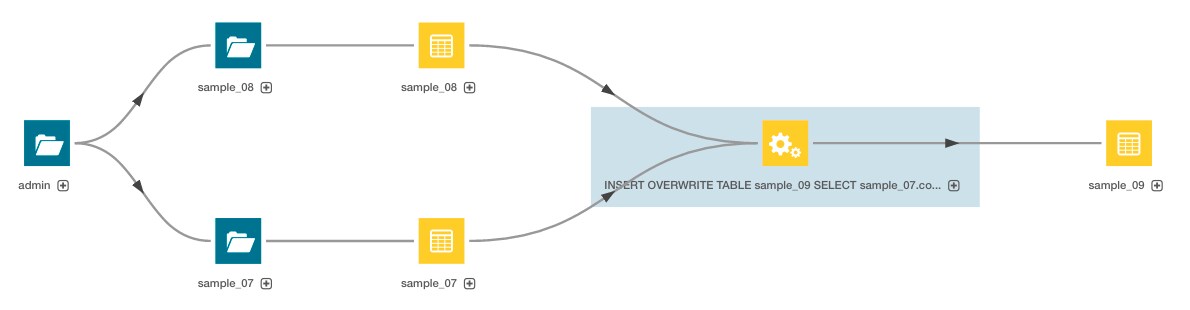
- Operations - In the diagram, the operation is hidden.
The green links indicate that one or more operations are collapsed into the links. - Deleted Entities - Here, the operation is hidden but deleted entities are displayed.
Searching a Diagram
You can search a lineage diagram for an entity by doing the following:- In the Search box at the right of the diagram, type an entity name. A list of matching entities displays below the box.
- Click an entity in the list. A blue box is drawn around the entity and the entity details display in a box below the Search box.
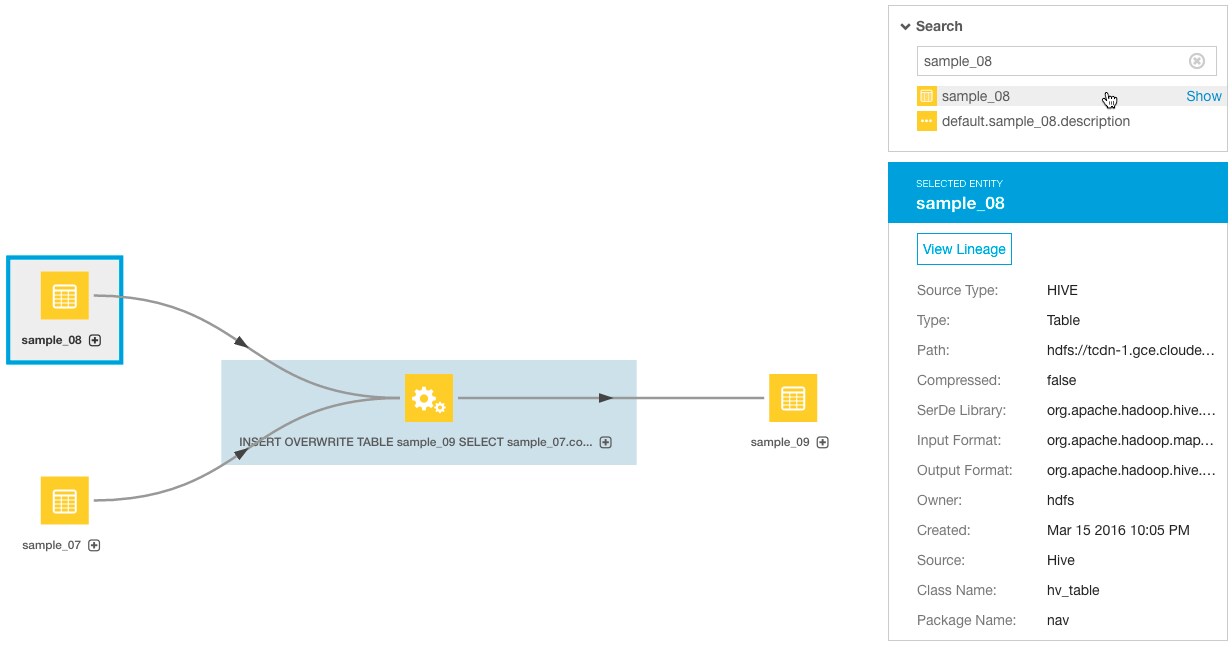
- Click the Show link next to the entity. The selected entity moves to the center of the diagram.
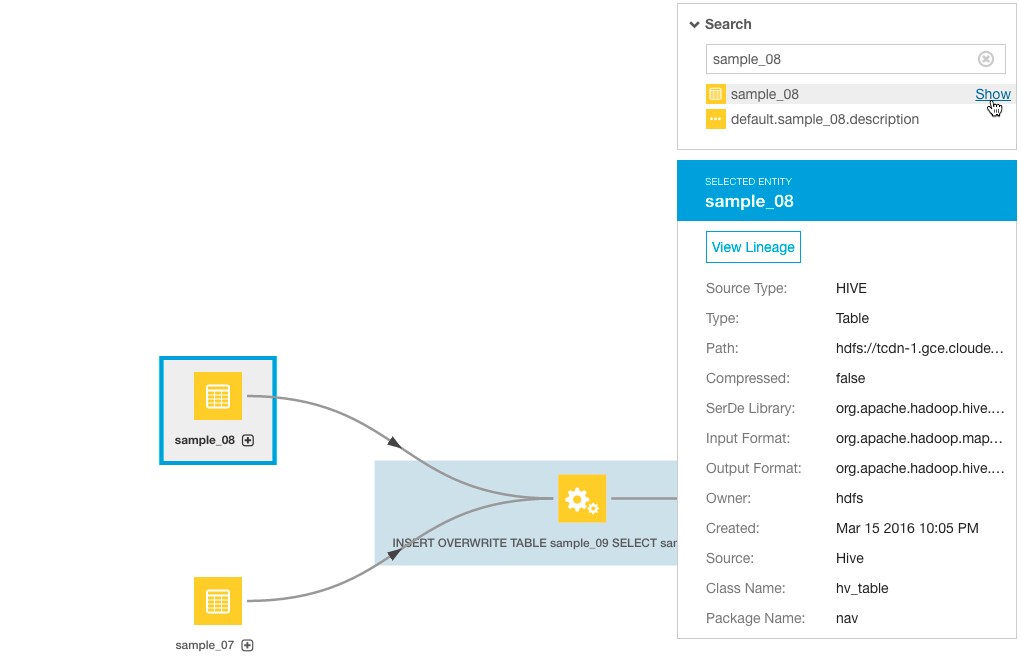
- Optionally, click the View Lineage link in the entity details box to view the lineage of the selected entity.
Displaying a Template Lineage Diagram
A template lineage diagram contains template entities, such as jobs and queries, that can be instantiated, and the input and output entities to which they are related.
- Perform a metadata search.
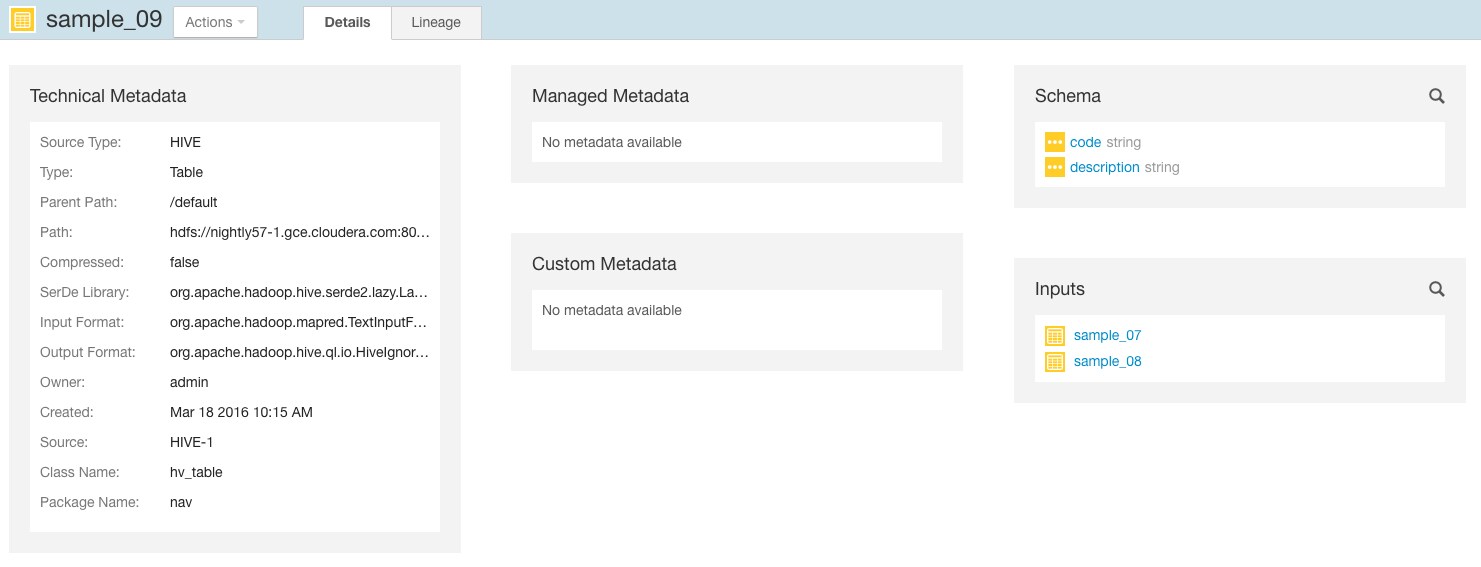
- In the list of results, click an entity. The entity Details page displays. For example, when you click the sample_09 result entry:

the Search screen is replaced with a Details page that displays the entity property sheet:
- Click the Lineage tab. For example, clicking the Lineage tab for the sample_09 table displays the following lineage diagram:
Displaying an Instance Lineage Diagram
An instance lineage diagram displays instance entities, such as job and query executions, and the input and output entities to which they are related. To display an instance lineage diagram:
- Perform a search and click a link of type Operation.
- Click a link in the Instances box.
- Click the Lineage tab.
Displaying the Template Lineage Diagram for an Instance Lineage Diagram
To browse from an instance diagram to its template:
- Display an instance lineage diagram.
- Click the Details tab.
- Click the value of the Template property to go to the instance's template.