Monitoring Impala Queries
The Impala Queries page displays information about the Impala queries that are running and have run in your cluster. You can filter the queries by time period and by specifying simple filtering expressions.
Viewing Queries
- Do one of the following:
- Select .
- On the tab, select Impala service name and click the Queries tab.
Configuring Impala Query Monitoring
You can configure the visibility of the Impala query results and the size of the storage allocated to Impala query results.
For information on how to configure whether admin and non-admin users can view all queries, only that user's queries, or no queries, see Configuring Query Visibility.
Query information is stored in-memory in a ring buffer. This has two consequences: if you restart Service Monitor, all queries are lost and older queries eventually will be dropped. For information on how to configure the query store, see Configuring Impala Query Data Store Maximum Size.
Impala Best Practices
To open the Impala Best Practices page, click the Best Practices tab on the Impala service page. The page contains charts to help identify whether Impala best practices are being followed. See the individual charts for a descriptions of each best practice and how to determine if it is being followed. Consult the Impala documentation for further detail on each best practice and for additional best practices.
Adjust the time range to see data on queries run at different times. Click on the charts to get more detail on individual queries. Use the filter box at the top right of the Best Practices page to adjust what data is shown on the page. For example, to see just the queries that took more than ten seconds, make the filter query_duration > 10s.
Create a trigger based on any best practice by choosing Create Trigger from the individual chart drop down menu.
Queries List
Queries appear in the list with the most recent at the top. Each query has summary and detail information. A query summary includes the following default attributes: start and end timestamps, statement, duration, rows produced, user, coordinator, database, and query type. For
example:

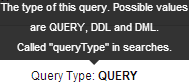
You can add additional attributes to the summary with the Attribute Selector. In each query summary, the query statement is truncated if it is too long to display. To display the entire statement, hover over a query. The query entry will expand to display the entire query string. To collapse the query display, move the mouse cursor. To display information about query attributes and possible values, hover over a field in a query. For example:
A running query displays  under the start timestamp. If an error occurred while processing
the query,
under the start timestamp. If an error occurred while processing
the query, displays under the complete timestamp.
To kill a running query, select . Only an administrator can
cancel queries and killing a query creates an audit event. When you cancel a query, replaces the
label. Once the page is refreshed, the entry is removed from the list.
replaces the
label. Once the page is refreshed, the entry is removed from the list.
When a job fails, asdf replaces the label.
To display query details, select .
To display all the queries run by the same user, select .
To display all the queries that used the same resource pool, select .
Filtering Queries
You filter queries by selecting a time range and specifying a filter expression in the text box.
You can use the Time Range Selector or a duration link (  ) to set the time range.
(See Time Line for details).
) to set the time range.
(See Time Line for details).
Filter Expressions
- Attribute - the query language name of the attribute.
- Operator - the type of comparison between the attribute and the attribute value. Cloudera Manager supports the standard comparator operators: =, !=, >, <, >=, <=, and RLIKE, which does regular expression matching as specified in the Java Pattern class documentation. Numeric values can be compared with all operators. String values can be compared with =, !=, and RLIKE. Boolean values can be compare with = and !=.
- Value - the value of the attribute. The value depends on the type of the attribute. For a Boolean value, specify either true or false. When specifying a string value, enclose the value in double quotes.
You create compound filter expressions using the AND and OR operators. When more than one operator is used in an expression, AND is evaluated first, then OR. To change the order of evaluation, surround subexpressions with parentheses.
Compound Expressions
user = "root" AND rowsProduced > 100
executing = true AND (user = "Jack" OR user = "Jill")
Choosing and Running a Filter
- Do one of the following:
- Select a Suggested or Recently Run Filter
- Click the
 to the right of the Search button to
display a list of sample and recently run filters, and select a filter. The filter text displays in the text box.
to the right of the Search button to
display a list of sample and recently run filters, and select a filter. The filter text displays in the text box.
- Click the
- Construct a Filter from Attribute Histograms
- Optionally, click the Select Attributes link to display a dialog where you can chose which attributes to display in histograms. Check the checkbox next to one or more attributes, and click Close.
- Click the Enhance Filter link. Histograms of the selected attributes display with the number of results that match each value of the selected attributes.
- Click a histogram bar that represents the range of attribute values to filter on. The color of the histogram bar gets lighter (on the right below)
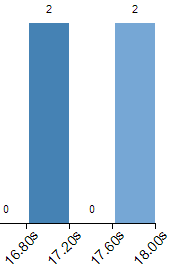
and a filter with the attribute value set to the range of the histogram bucket is added to the text box. The range includes the lower bound of the bucket and excludes the upper bound of the bucket. For example:(<x>_duration >= 17600.0 AND <x>_duration < 18000.0)
where <x> is query or application.If you click the same histogram bar again, the color reverts to the darker blue and the filter is removed from the text box.
If you click another histogram bar, another filter is OR'd with the existing filter:(<x>_duration >= 17600.0 AND <x>_duration < 18000.0 OR <x>_duration >= 16000.0 AND <x>_duration < 16400.0)
- Type a Filter
- Start typing or press Spacebar in the text box. As you type, filter attributes matching the letter you type display. If you press Spacebar, standard filter attributes display. These suggestions are part of typeahead, which helps build valid queries. For information about the attribute name and supported values for each field, hover over the field in an existing query.
- Select an attribute and press Enter.
- Press Spacebar to display a drop-down list of operators.
- Select an operator and press Enter.
- Specify an attribute value in one of the following ways:
- For attribute values that support typeahead, press Spacebar to display a drop-down list of values and press Enter.
- Type a value.
- Select a Suggested or Recently Run Filter
- Put the cursor on the text box and press Enter or click Search. The list displays the results that match the specified filter. If the histograms are showing, they are redrawn to show only the values for the selected filter. The filter is added to the Recently Run list.
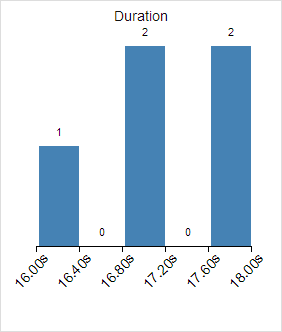
Example: Drilling into Query Results
Suppose we have a set of results with the following duration distribution :
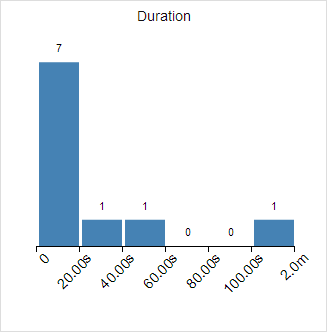
The 0-20.00s bucket has 7 results, but with the current distribution we cannot discriminate between the results in that bucket.
<x>_duration >= 0.0 AND <x>_duration < 20000.0
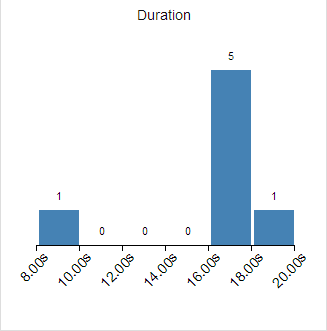
<x>_duration >= 16000.0 AND <x>_duration < 18000.0After clicking Search again, the histogram appears as follows:
Filter Attributes
The available filter attributes, their names as they are displayed in Cloudera Manager, their types, and descriptions, are enumerated below.
|
Attribute |
Display Name |
Value Type |
Description |
|---|---|---|---|
|
bytes_streamed |
Bytes Streamed |
BYTES |
The total number of bytes sent between Impala daemons while processing the query. |
|
coordinator_host_id |
Coordinator |
STRING |
The host coordinating the query. |
|
database |
Database |
STRING |
The database on which the query was run. |
| ddl_type | DDL Type | STRING | The type of DDL query. |
|
executing |
Executing |
BOOLEAN |
Whether the query is currently executing. |
|
file_formats |
File Formats |
STRING |
The file formats used in the query. A file format is a string of the form: File Type/Compression Type, where File Type can take the values: TEXT, PARQUET, SEQUENCE_FILE, and RC_FILE, and Compression Type can take the values: NONE, DEFAULT, BZIP2. For further information, see How Impala Works with Hadoop File Formats. |
|
hbase_bytes_read |
HBase Bytes Read |
BYTES |
The total number of bytes read from HBase by the query. |
|
hbase_bytes_read_per_second |
HBase Read Throughput |
BYTES_PER_SECOND |
The overall HBase read throughput (in B/s) of the query. |
|
hdfs_bytes_read |
HDFS Bytes Read |
BYTES |
The total number of bytes (in GiB) read from HDFS by the query. |
|
hdfs_bytes_read_local |
HDFS Local Bytes Read |
BYTES |
The total number of local bytes read (in GiB) from HDFS by the query. |
|
hdfs_bytes_read_local_percentage |
HDFS Local Bytes Read Percentage |
NUMBER |
The percentage of all bytes read from HDFS by the query that were local. |
|
hdfs_bytes_read_per_second |
HDFS Read Throughput |
BYTES_PER_SECOND |
The overall HDFS read throughput (in B/s) of the query. |
| hdfs_bytes_read_remote | HDFS Remote Bytes Read | BYTES | The total number of remote bytes read from HDFS by this query. |
| hdfs_bytes_read_remote_percentage | HDFS Remote Bytes Read Percentage | NUMBER | The percentage of all bytes read from HDFS by this query that were remote. |
|
hdfs_bytes_read_short_circuit |
HDFS Short Circuit Bytes Read |
BYTES |
The total number of bytes (in GiB) read from HDFS by the query that used short-circuit reads. |
|
hdfs_bytes_read_short_circuit_percentage |
HDFS Short Circuit Bytes Read Percentage |
NUMBER |
The percentage of all bytes (in GiB) read from HDFS by the query that used short-circuit reads. |
|
hdfs_bytes_skipped |
HDFS Bytes Skipped |
BYTES |
The total number of bytes that had to be skipped by the query while reading from HDFS. Any number above zero may indicate a problem. |
| memory_accrual | Memory Accrual | BYTE_SECONDS | The total accrued memory usage by the query. This is computed by multiplying the average aggregate memory usage of the query by the query's duration. |
| memory_aggregate_peak | Aggregate Peak Memory Usage | BYTES | The highest amount of memory allocated by this query at a particular time across all nodes. |
| memory_per_node_peak | Per Node Peak Memory Usage | BYTES | The highest amount of memory allocated by any single node that participated in this query. See Node With Peak Memory Usage for the name of the peak node. |
| memory_per_node_peak_node | Node With Peak Memory Usage | STRING | The node with the highest peak memory usage for this query. |
| network_address | Network Address | STRING | The network address that issued this query. |
| pool | Pool | STRING | The name of the YARN pool to which this query was issued. Within YARN, a pool is referred to as a queue. |
| pool_wait_time | Pool Wait Time | MILLISECONDS | The total amount of time the query spent waiting for pool resources to become available. |
|
query_duration |
Duration |
MILLISECONDS |
The duration of the query in milliseconds. |
|
query_id |
Query ID |
STRING |
The ID of the query. |
|
query_state |
Query State |
STRING |
The current state of the query: CREATED, INITIALIZED, COMPILED, RUNNING, FINISHED, UNKNOWN, EXCEPTION. If the query has failed or been canceled, queryState will be EXCEPTION. |
|
query_status |
Query Status |
STRING |
The status of the query. If the query failed, queryStatus will contain diagnostic info such as Memory limit exceeded, Failed to write row .... If canceled, queryStatus is Canceled. Otherwise, queryStatus is OK. |
|
query_type |
Query Type |
STRING |
The type of the query's SQL statement: DML, DDL, QUERY, UNKNOWN. |
|
rows_produced |
Rows Produced |
NUMBER |
The number of rows returned by the query. |
| service_name | Service Name | STRING | The name of the Impala service. |
| session_id | Session ID | STRING | The ID of the session that issued this query. |
| session_type | Session Type | STRING | The type of the session that issued this query. |
| stats_missing | Stats Mission | BOOLEAN | Whether the query was flagged with a missing table or column statistics warning during the planning process. |
|
statement |
Statement |
STRING |
The query's SQL statement. |
| thread_cpu_time | Threads: CPU Time | MILLISECONDS | The sum of the CPU time used by all threads of the query. |
| thread_cpu_time_percentage | Threads: CPU Time Percentage | NUMBER | The sum of the CPU time used by all threads of the query divided by the total thread time. |
| thread_network_wait_time | Threads: Network Wait Time | MILLISECONDS | The sum of the time spent waiting for the network by all threads of the query. |
| thread_network_wait_time_percentage | Threads: Network Wait Time Percentage | NUMBER | The sum of the time spent waiting for the network by all threads of the query divided by the total thread time. |
| thread_storage_wait_time | Threads: Storage Wait Time | MILLISECONDS | The sum of the time spent waiting for storage by all threads of the query. |
| thread_storage_wait_time_percentage | Threads: Storage Wait Time Percentage | NUMBER | The sum of the time spent waiting for storage by all threads of the query divided by the total thread time. |
| thread_total_time | Threads: Total Time | MILLISECONDS | The sum of thread CPU, storage wait, and network wait times used by all threads of the query. |
|
user |
User |
STRING |
The user who issued the query. |
Examples
Consider the following filter expressions: user = "root", rowsProduced > 0, fileFormats RLIKE ".TEXT.*", and executing = true. In the examples:
- The filter attributes are user, rowsProduced, fileFormats, and executing.
- The operators are =, >, and RLIKE.
- The filter values are root, 0, .TEXT.*, and true.