Cloudera Navigator Analytics
Cloudera Navigator allows you to view metadata and audit analytics for HDFS entities. On the analytics pages, you can view which HDFS entities satisfy the following property values:
- Metadata - the number of files by creation and access times, size, block size, and replication count. After selecting a property value range for one of these properties, you can filter the matching files by directory, owner, and tag.
- Audit
- Activity tab - by directory which files have been accessed using the open operation and how many times they have been accessed. Activity analytics are based on summarized data computed once a day and will not match the number of events viewed in the Audits tab at all times.
- Top Users tab - the top-n commands and the top-n users and top n commands those users performed during various time windows (1 min–1 day), where n is 1, 5, 10, 20, 50, or 100.
Viewing Metadata Analytics
- Start and log into the Cloudera Navigator data management component UI.
- Click the Analytics tab. The Metadata analytics tab displays.
- Choose an HDFS service instance from the service_name Analytics drop-down list.
- The Metadata tab displays a set of bar graphs that list the number of files that satisfy groups of values for last access time, created time, size, block size, and replication count.
- To display the files at the right, click a bar. This draws a blue selection outline around the bar and selects the property checkbox.
- To select more than one value, grab a bar edge and brush a range of values.
- To change a range, click a bar, drag to a different range of values, and drop.
- To reduce a range, grab a bar edge and contract the range.
- To deselect a property, deselect the checkbox. The previous selection is indicated with a gray outline.
- When you select a previously selected property, the previous selection is reused. For example, if you had previously selected one and three for replication count, and you reselect the replication count checkbox, the values one and three are reselected.
- To clear all selections, present and previous, click Clear all selections.
- In the listing on the right, select an option to display the number of files by directory, owner, or tag. In the listing:
- Filter the selections by typing strings in the search box and pressing Enter or Return.
- Add categories (directory, owner, or tag) to a search query and display the Search tab by doing one of the following:
- Clicking a directory, owner, or tag name link.
- Selecting . To further refine the query, select one or more checkboxes, and select .
 Add categories to the search query of a new policy and display the Policies
tab by selecting . To further refine the query, select one or more
checkboxes, and select .
Add categories to the search query of a new policy and display the Policies
tab by selecting . To further refine the query, select one or more
checkboxes, and select .
Viewing Audit Analytics
- Start and log into the Cloudera Navigator data management component UI.
- Click the Analytics tab. If the logged-in user has a role that permits access to metadata analytics, the Metadata analytics tab displays.
- Choose an HDFS service instance from the service_name Analytics drop-down list.
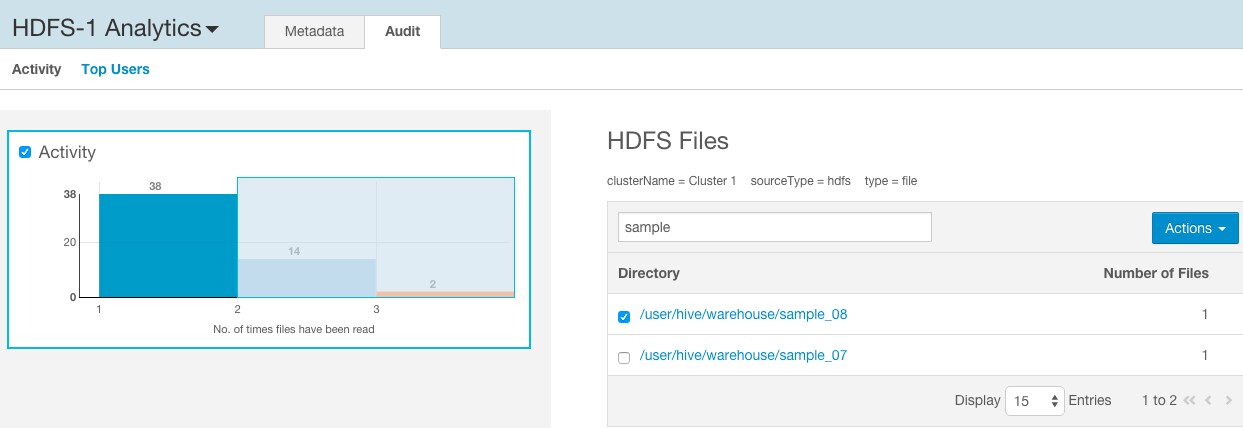
- If not already displayed, click the Audits tab. The Activity tab displays a bar graph that lists the number of files that have been read the number of
times listed in the x-axis.
- To display at the right the directories containing the files that have been read, click an activity bar. This draws a blue selection outline around the bar and selects the Activity checkbox.
- To select more than one value, grab a bar edge and brush a range of values.
- To change a range, click a bar, drag to a different range of values, and drop.
- To reduce a range, grab a bar edge and contract the range.
- To deselect Activity, deselect the checkbox. The previous selection is indicated with a gray outline.
- When you select Activity and the graph had a previous selection, the previous selection is reused. For example, if you had previously selected values spanning six through nine for the number of times files have been read, and you select the checkbox, six through nine will be reselected.
- In the directory listing on the right:
- Filter the directories by typing directory strings in the search box and pressing Enter or Return.

 Add selected directories to a search query and display the Search tab by doing one of the following:
- Clicking a directory name link.
- Selecting one or more directory checkboxes and selecting .
- Add selected directories to the search query of a new policy and display the Policies tab by selecting one or more directory checkboxes and selecting .