Using Query Plan Graph View for Hive Web UI
Visualize your query plans with the Query Plan Graph View in the Hive Web User Interface.
Benefits of the Query Plan Graph View
Use the Query Plan Graph View to:
- Follow in real-time as your Hive query executes.
- Watch MapReduce jobs unfold on the progress bar and examine their statistics.
- See clearly which tasks in a plan are executed and which are filtered out.
- Find logs for the individual stages of a query execution plan.
- Spot errors quickly.
- Pinpoint problems for failed or hanging queries.
Query Plan Graph View Overview
The query plan graph maps out every step of your query execution plan and indicates the current status of each step with a color:
|
Color |
Execution Step Status |
|---|---|
|
Green |
Successfully completed |
|
Red |
Error occurred |
|
Blue |
Currently executing |
|
Grey |
Might mean one of the following:
|
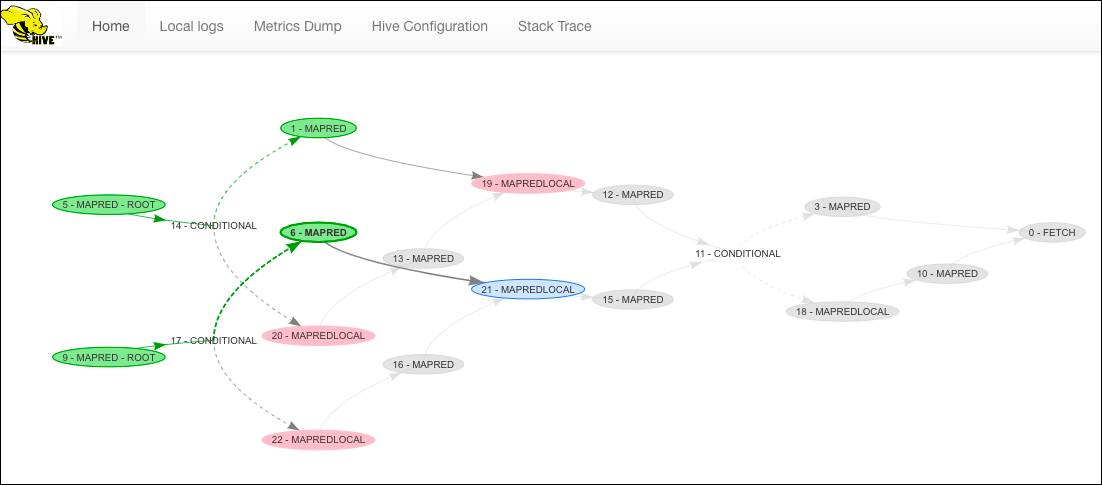
An example of the Query Plan Graph View during the execution process.
Activating the Query Plan Graph View
Follow these steps to enable the Query Plan Graph View in your HiveServer2 Web User Interface.
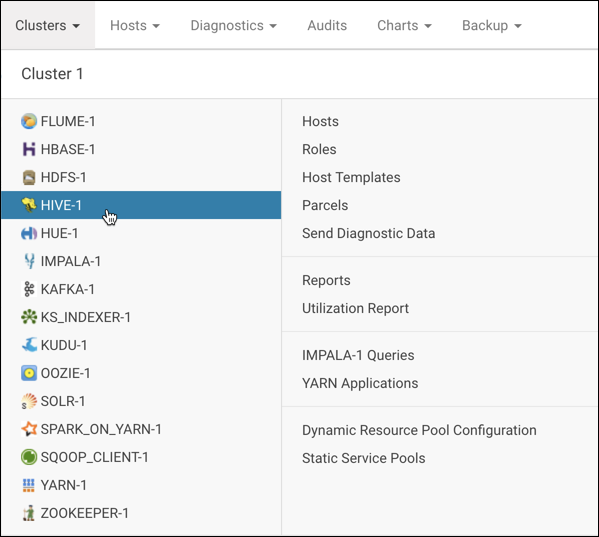
- Log in to the Cloudera Manager Admin Console.
- Click Clusters in the top navigation bar, and choose Hive from the list of service instances.
- Click the Configuration tab on the Hive service page to edit the configuration.
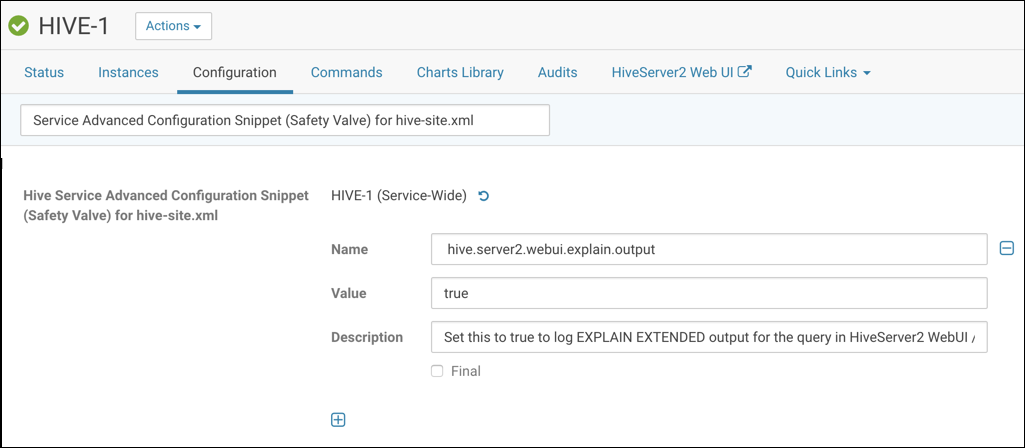
- In the Search field, search for Service Advanced Configuration Snippet (Safety Valve) for hive-site.xml
- Click the plus sign (+), and add the following configurations one at a time to the Service Advanced Configuration Snippet (Safety
Valve):
Name Value Description (optional) hive.server2.webui.explain.output
true
Set this to true to log EXPLAIN EXTENDED output for the query in HiveServer2 WebUI / Drilldown / Query Plan.
hive.server2.webui.show.graph
true
Set this to true to display the Query Plan Graph View instead of text in the WebUI.
hive.server2.webui.max.graph.size
40
The maximum number of stages the Query Plan Graph View can display. Recommended value: 40 (for the best view). Default value: 25.
hive.server2.webui.show.stats
true
Set this to true to display the statistics and log files of MapReduce tasks in the WebUI.
Configuring the Service Advanced Configuration Snippet (Safety Valve)
- Enter a Reason for change, and then click Save Changes to commit the changes.
- After your change is saved, click the restart icon above the Configuration tab.
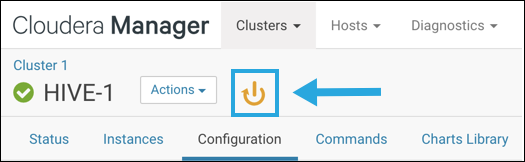
If you don’t see the reset icon, try refreshing your browser.
- Click Restart Stale Services, and then click Restart Now.
- Click Finish after the restart completes.
Viewing the Query Plan Graph View
View the Query Plan Graph in the query Drilldown page at any time during or after executing a query. To find it:
- Log in to the Cloudera Manager Admin Console.
- Click Clusters in the top navigation bar, and choose Hive from the list of service instances.
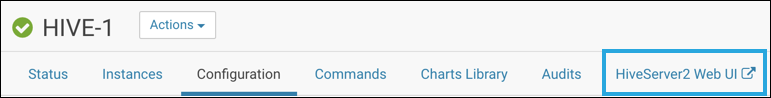
- Click the HiveServer2 Web UI in the Hive toolbar, and select the HiveServer2 Web UI for the cluster node that you want to
view.
- On the HiveServer2 page, find your query and click Drilldown to view more details. The query could be listed under Open Queries or Closed Queries depending on its status.
- Click the Query Plan tab on the Drilldown page to open the Query Plan Graph View.
- Select any step of the plan to see a detailed view of that stage and its statistics. These appear below the graph.