Cloudera Navigator Auditing Architecture
In addition to metadata management, another primary capability provided by Cloudera Navigator with governance and security teams in mind is its auditing function.
Events are the actions that occur throughout the cluster during regular operations, often accompanied by internal system messages that convey information about success or failure and include other details about the internal process. In general, events can be captured to log files or recorded in various ways.
Cloudera Manager records lifecycle events at the cluster, host, role, service, and user level, and records actions that involve licenses and parcels. Downloading a parcel is one example of a lifecyle event captured by Cloudera Manager; starting up the cluster is another. In addition to lifecycle events, Cloudera Manager also captures security-related events, such as adding users, deleting users, login failures, and login successes. See Lifecycle and Security Auditing for more information about Cloudera Manager's inherent auditing capabilities.
Cloudera Navigator generates some of its own events and also coalesces events generated by the services running on the cluster.
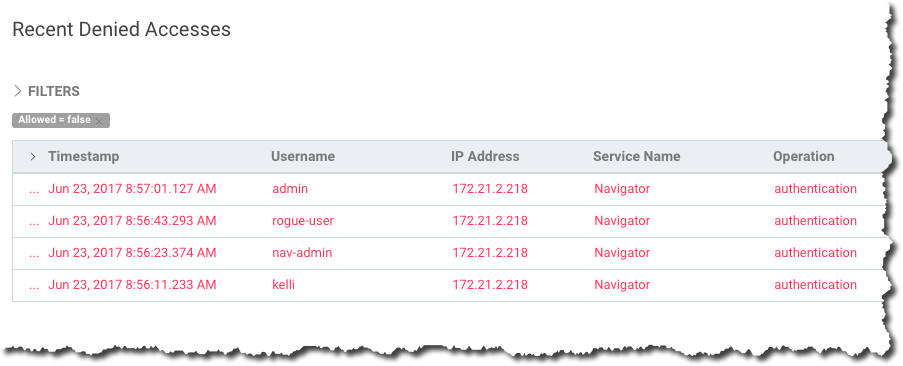
The Cloudera Navigator console lets you view audit events. Several pre-configured reports are available but you can use the filters and quickly create your own reports, export as CSV or JSON, or simply view in the console. For example, here is a partial export:
Cloudera Navigator Auditing Architecture
The figure below shows a high level view of the Cloudera Navigator auditing architecture:
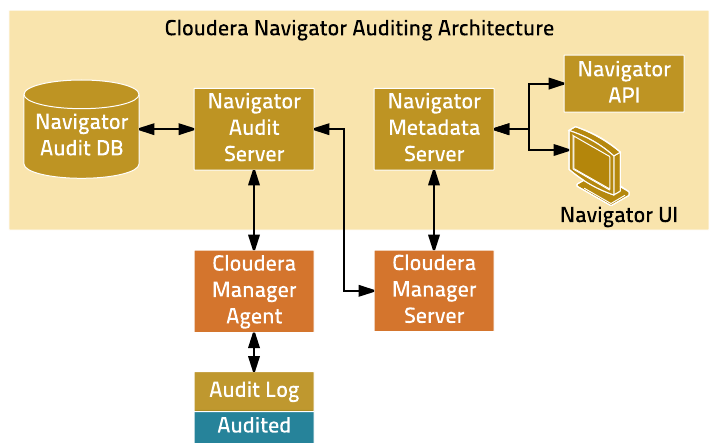
During system setup, plug-ins for the various services—HDFS, HBase, and Hive (HiveServer2, Beeswax servers) services, for example—are enabled. These plug-ins work with the service to collect and filter events emitted by the respective service, writing the events to an audit log on the local filesystem. Impala, Sentry, and the Cloudera Navigator Metadata Server also collect and filter events and write them to their respective audit log files.
Auditing Architecture In More Detail: How It Works
Here is some more detail about the auditing architecture and interaction among Cloudera Manager Agent, local log file, and Navigator Audit Server.
The Cloudera Manager Agent process on each host in the cluster:
- Monitors local audit log files
- Sends events captured in the logs to the Navigator Audit Server
- Retries sending any event that fails to transmit successfully
- Keeps track of successfully transmitted events from the logfile (offset position in the file) to prevent re-sending any already processed events after a system failure and restart
- Purges old audit logs after successful transmission to the Navigator Audit Server
Once any event is written to the audit log file (and assuming space available on the filesystem), its delivery is guaranteed. In other words, transient (in-memory) buffer handling is not involved in this part of the process. Audit logs are rotated and the Cloudera Manager Agent follows the rotation of the log.
The plug-in for each of the various services effectively writes the events to the audit log file. Policies for queue A plug-in that fails to write an event to the audit log file can either drop the event or can shut down the process in which it is running depending on the configured queue policy.
- Tracks and coalesces events obtained from Cloudera Manager
- Stores events to the Navigator Audit database