Exploring Audit Data Using the Cloudera Navigator Console
Required Role: Auditing Viewer (or Full Administrator)
Logging in to the Cloudera Navigator Console
- Open your browser.
- Navigate to the host within the cluster running the Cloudera Navigator Metadata Server role. Replace the example host name with the appropriate host name in your cluster, and replace
the default port (7187) if necessary.
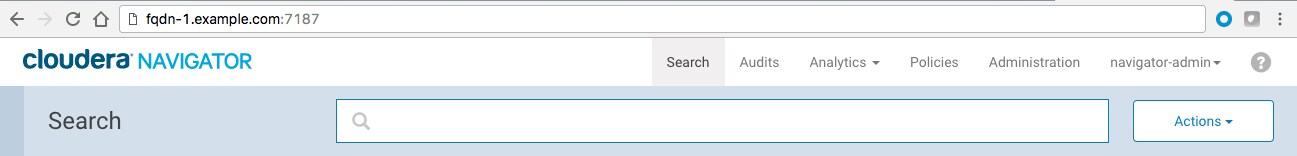
http://fqdn-1.example.com:7187/login.html
The login page displays. - Log in to the Cloudera Navigator console using the credentials assigned by your
administrator. The Cloudera Navigator console displays:
- See Getting Started with Cloudera Navigator for a general overview of the Cloudera Navigator console.
- See Accessing the Cloudera Navigator Console for details about the alternative path to the Cloudera Navigator console, that is, from the Cloudera Manager Admin Console. That access path requires having Cloudera Manager Full Administrator or the Cloudera Manager Navigator Administrator role.
Viewing Audit Events
- Click the Audits tab. By default, the Audit Events report opens, listing all events that occurred within the last hour, with the most recent at the
top:
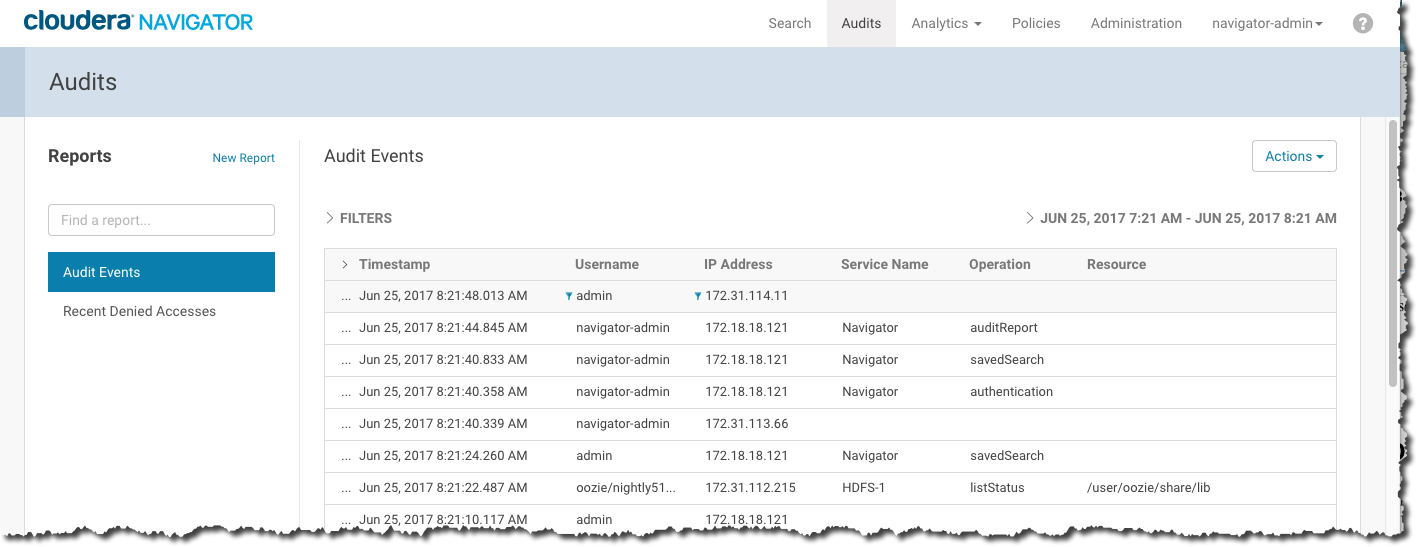
The Audit Events and Recent Denied Accesses reports are available by default. You create your own reports and apply a variety of filters as detailed in the next section.
Filtering Audit Events
You filter audit events by specifying a time range or adding one or more filters containing an audit event field, operator, and value.
Specifying a Time Range
- Click the date-time range at the top right of the Audits tab.
- Do one of the following:
- Click a Last n hours link.
- Specify a custom range:
- Click Custom range.
- In the Selected Range endpoints, click each endpoint and specify a date and time in the date control fields.
- Date - Click the down arrow to display a calendar and select a date, or click a field and click the spinner arrows or press the up and down arrow keys.
- Time - Click the hour, minute, and AM/PM fields and click the spinner arrows or press the up and down arrow keys to specify the value.
- Move between fields by clicking fields or by using the right and left arrow keys.
- Click Apply.
Adding a Filter
- Do one of the following:
- Click the
 icon that displays next to a field when you hover in one of the event entries.
 - Click the Filters link. The Filters pane displays.
- Click Add New Filter to add a filter.
- Choose a field in the Select Property... drop-down list. You can search by fields such as username, service name, or operation. The fields vary depending on the service or role. The service name of the Navigator Metadata Server is Navigator.
- Choose an operator in the operator drop-down list.
- Type a field value in the value text field. To match a substring, use the like operator. For example, to see all the audit events for files created in the folder /user/joe/out, specify Source like /user/joe/out.
- Click the
- Click Apply. A field, operation, and value breadcrumb is added above the list of audit events and the list of events displays all events that match the filter criteria.
Removing a Filter
- Do one of the following:
- Click the x next to the filter above the list of events. The list of events displays all events that match the filter criteria.
- Click the Filters link. The Filters pane displays.
- Click the
 at the right of the filter.
 - Click Apply. The filter is removed from above the list of audit event and the list of events displays all events that match the filter criteria.
- Click the
Monitoring Navigator Audit Service Health
Cloudera recommends that administrators monitor the Navigator Audit Service to ensure that it is always running. This is especially important when complete and immutable audit records may be needed for corporate governance, legal, and other purposes associated with compliance.
The Navigator Audit Service has a self-check—the Audit Pipeline Health Check—that administrators can enable to generate warning messages when the system slows down or fails. The health check keeps track of bytes—for audits processed, audits remaining to be processed, and count of errors when sending audit data from Cloudera Manager Agent process to Cloudera Manager.
- Audit bytes process = 0
- Audit bytes unprocessed != 0
- Send errors > 0 and retries unsuccessful
The health check is run for each service role (daemon) that generates events.
Configuring the Audit Pipeline Health Check
Cloudera Manager Required Role: Navigator Administrator (or Full Administrator)
- Select .
- Click the Configuration tab.
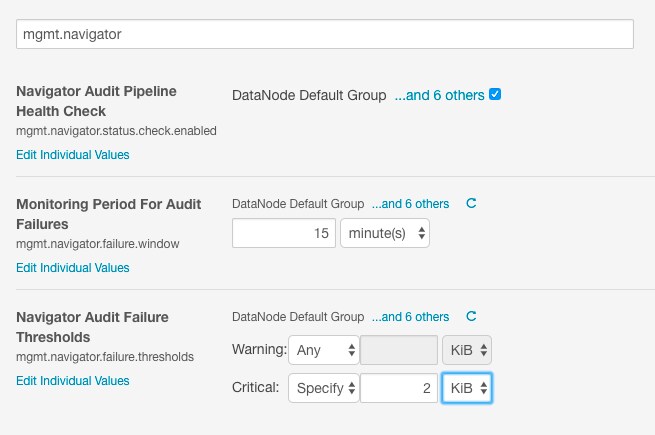
- In the Search field, type "mgmt.navigator" to find the configuration properties, as shown below:
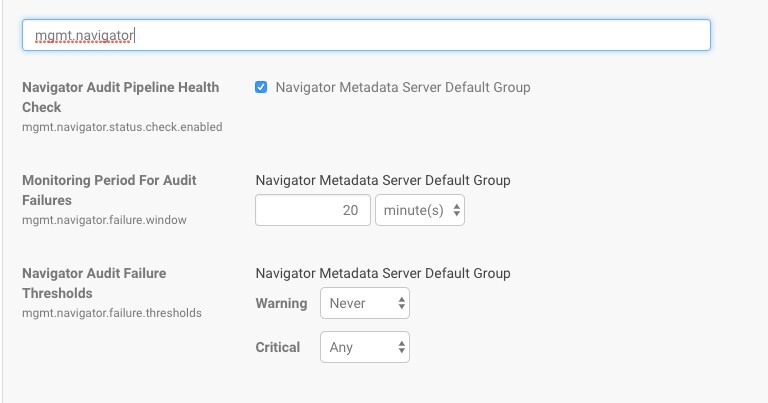
- Modify the settings:
Property Description Navigator Audit Pipeline Health Check Check the box to enable the healthcheck. Health check can be enabled for specific groups. By default, the health check is enabled for all groups. Monitoring Period for Audit Failures Amount of time within which the counts of audits processed and other metrics are evaluated before generating warnings. The default is 20 minutes. Navigator Audit Failure Thresholds Size (in bytes) of audit failure that generates messages. Two different thresholds are available: Warning, and Critical. Set Warning to the number of bytes of unsent audit data at which you want a warning triggered. Critical messages are sent for any failure regardless of size. - Click Save Changes.
For example, as shown in the Cloudera Manager Admin Console, the pipeline health check is enabled for all groups in the service. The failure period is set to 15 minutes, and the health check sends a warning for failures of any size and a critical error when more than 2 KiB of audit events have not been sent.