Cloudera Navigator Analytics
Cloudera Navigator's powerful metadata management capabilities underpin its Analytics features. Improved significantly and fully-enabled as of Cloudera Navigator 2.10, the Cloudera Navigator console lets you view metadata and audit analytics through several graphically rich dashboards, including the Data Stewardship Dashboard and Data Explorer. This section focuses on the HDFS Analytics menu of the Cloudera Navigator console and how to use it to
Viewing Metadata Analytics
Required Role: Lineage Viewer and Policy Administrator (or Full Administrator)
- Open your browser.
- Navigate to the host within the cluster running the Cloudera Navigator Metadata Server role, replacing the URL with the appropriate path.
http://fqdn-1.example.com:7187/login.html
The login page displays. - Log in to the Cloudera Navigator console using the credentials assigned by your administrator.
- Click the Analytics tab. The Metadata analytics tab displays.
- Click the Source button and select an HDFS service instance from the drop-down list.
- The Metadata tab displays a set of bar graphs that list the number of files that satisfy groups of values for last access time, created time, size, block size, and replication count.
- To display the files at the right, click a bar. This draws a blue selection outline around the bar and selects the property checkbox.
- To select more than one value, grab a bar edge and brush a range of values.
- To change a range, click a bar, drag to a different range of values, and drop.
- To reduce a range, grab a bar edge and contract the range.
- To clear a property, clear the checkbox. The previous selection is indicated with a gray outline.
- When you select a previously selected property, the previous selection is reused. For example, if you had previously selected one and three for replication count, and you reselect the replication count checkbox, the values one and three are reselected.
- To clear all selections, present and previous, click Clear all selections.
- In the listing on the right, select an option to display the number of files by directory, owner, or tag. In the listing:
- Filter the selections by typing strings in the search box and pressing Enter or Return.
- Add categories (directory, owner, or tag) to a search query and display the Search tab by doing one of the following:
- Clicking a directory, owner, or tag name link.
- Selecting . To further refine the query, select one or more checkboxes, and select .
-
Required Role: Policy Administrator (or Full Administrator)
Add categories to the search query of a new policy and display the Policies tab by selecting . To further refine the query, select one or more checkboxes, and select .
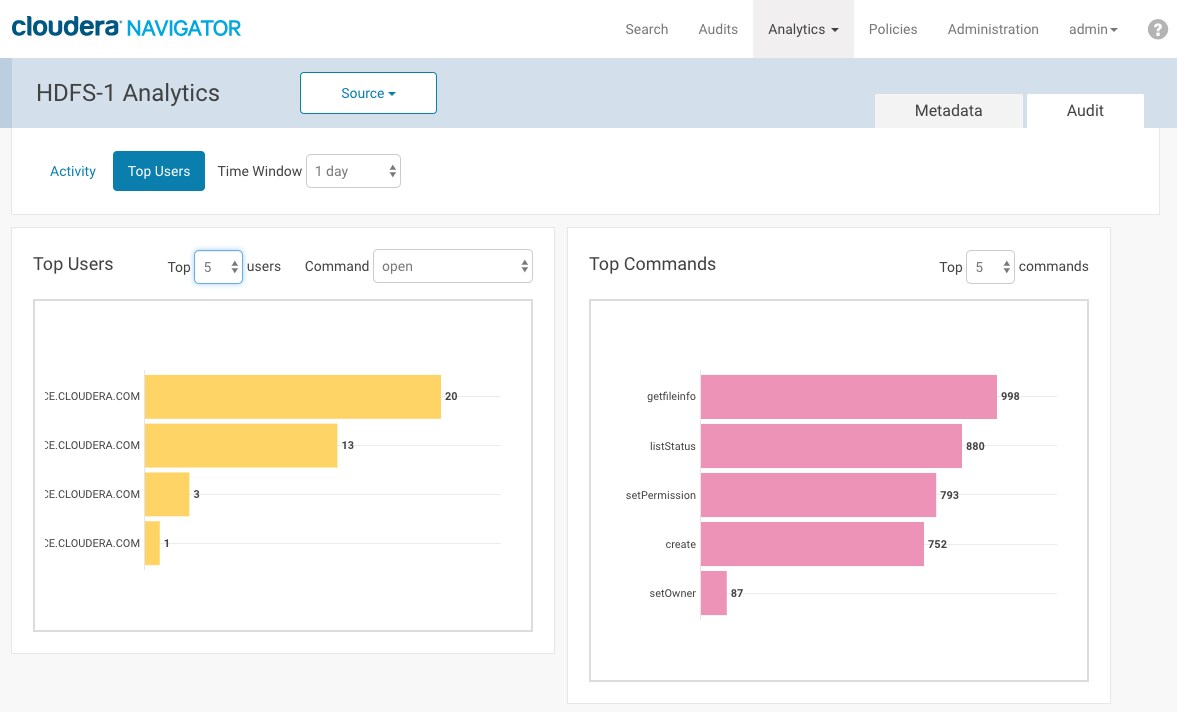
Viewing Audit Analytics
Required Role: Auditing Viewer (or Full Administrator)
- Accessing the Cloudera Navigator console.
- Click the Analytics tab. If the logged-in user has a role that permits access to metadata analytics, the Metadata analytics tab displays.
- Click the Source button and select an HDFS service instance from the drop-down list.
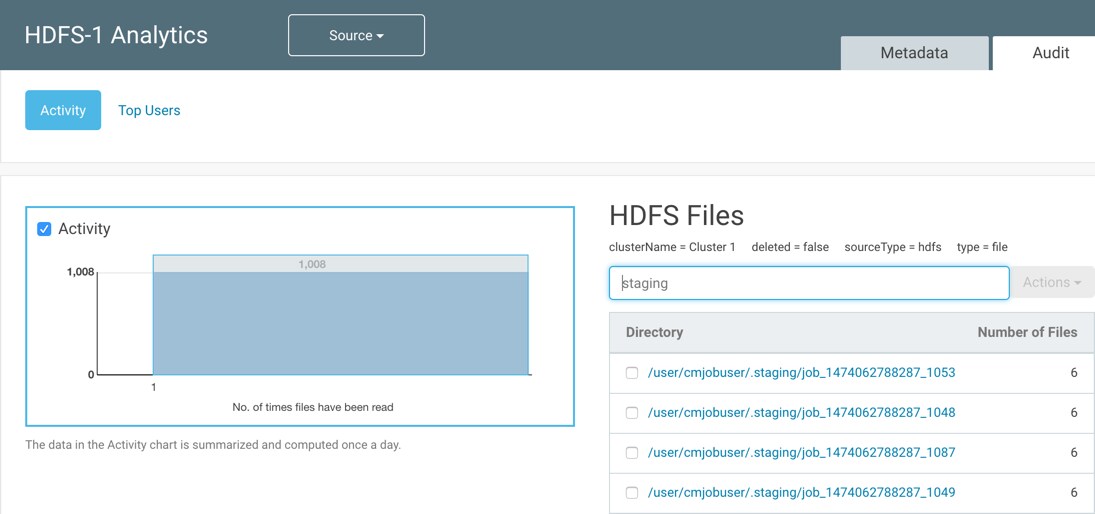
- If not already displayed, click the Audit tab. The Activity tab displays a bar graph that lists the number of files that have been read the number of
times listed in the x-axis.
- To display at the right the directories containing the files that have been read, click an activity bar. This draws a blue selection outline around the bar and selects the Activity checkbox.
- To select more than one value, grab a bar edge and brush a range of values.
- To change a range, click a bar, drag to a different range of values, and drop.
- To reduce a range, grab a bar edge and contract the range.
- To clear Activity, clear the checkbox. The previous selection is indicated with a gray outline.
- When you select Activity and the graph had a previous selection, the previous selection is reused. For example, if you had previously selected values spanning six through nine for the number of times files have been read, and you select the checkbox, six through nine will be reselected.
- In the directory listing on the right:
- Filter the directories by typing directory strings in the search box and pressing Enter or Return.
-
Required Role: Lineage Administrator (or Metadata Administrator, Full Administrator)
Add selected directories to a search query and display the Search tab by doing one of the following:- Clicking a directory name link.
- Selecting one or more directory checkboxes and selecting .
-
Required Role: Metadata Viewer (or Metadata Administrator, Full Administrator)
Required Role: Lineage Administrator (or Metadata Administrator, Full Administrator)
Add selected directories to the search query of a new policy and display the Policies tab by selecting one or more directory checkboxes and selecting .
For example, the following screenshot shows files that have been accessed once and match the string staging. Each directory has six files that has been
accessed.