Introduction
Data lifecycle data reporting: We will analyze datasets using Cloudera Data Warehouse on Cloudera on cloud.
We will be looking at a synthetic data set for an electric car company. It contains information on a specific experimental motor used in different car models. It was determined that faulty materials were used in a batch of electric motors. We will do some data discovery and create an easy-to-read dashboard.
Prerequisites
- Have access to Cloudera on cloud
- Have created a Cloudera workload User
- Basic AWS CLI skills
Download assets
There are two (2) options in getting assets for this tutorial:
It contains only necessary files used in this tutorial. Unzip tutorial-files.zip and remember its location.
It provides assets used in this and other tutorials; organized by tutorial title.
Using AWS CLI, copy the following data files to your S3 bucket, defined by your environment’s storage.location.base attribute:
experimental-motor-enriched.csv
Note: You may need to ask your environment's administrator to get property value for storage.location.base.
For example, property storage.location.base has value s3a://usermarketing-cdp-demo; we will copy the files using the command:
aws s3 cp experimental-motor-enriched.csv s3://usermarketing-cdp-demo/experimental-motor-enriched.csv

If you see ![]() next to your environment name, you’re all set - the Database Catalog has been created using the naming convention, environment-default.
next to your environment name, you’re all set - the Database Catalog has been created using the naming convention, environment-default.
Otherwise, click on ![]() to activate the environment.
to activate the environment.
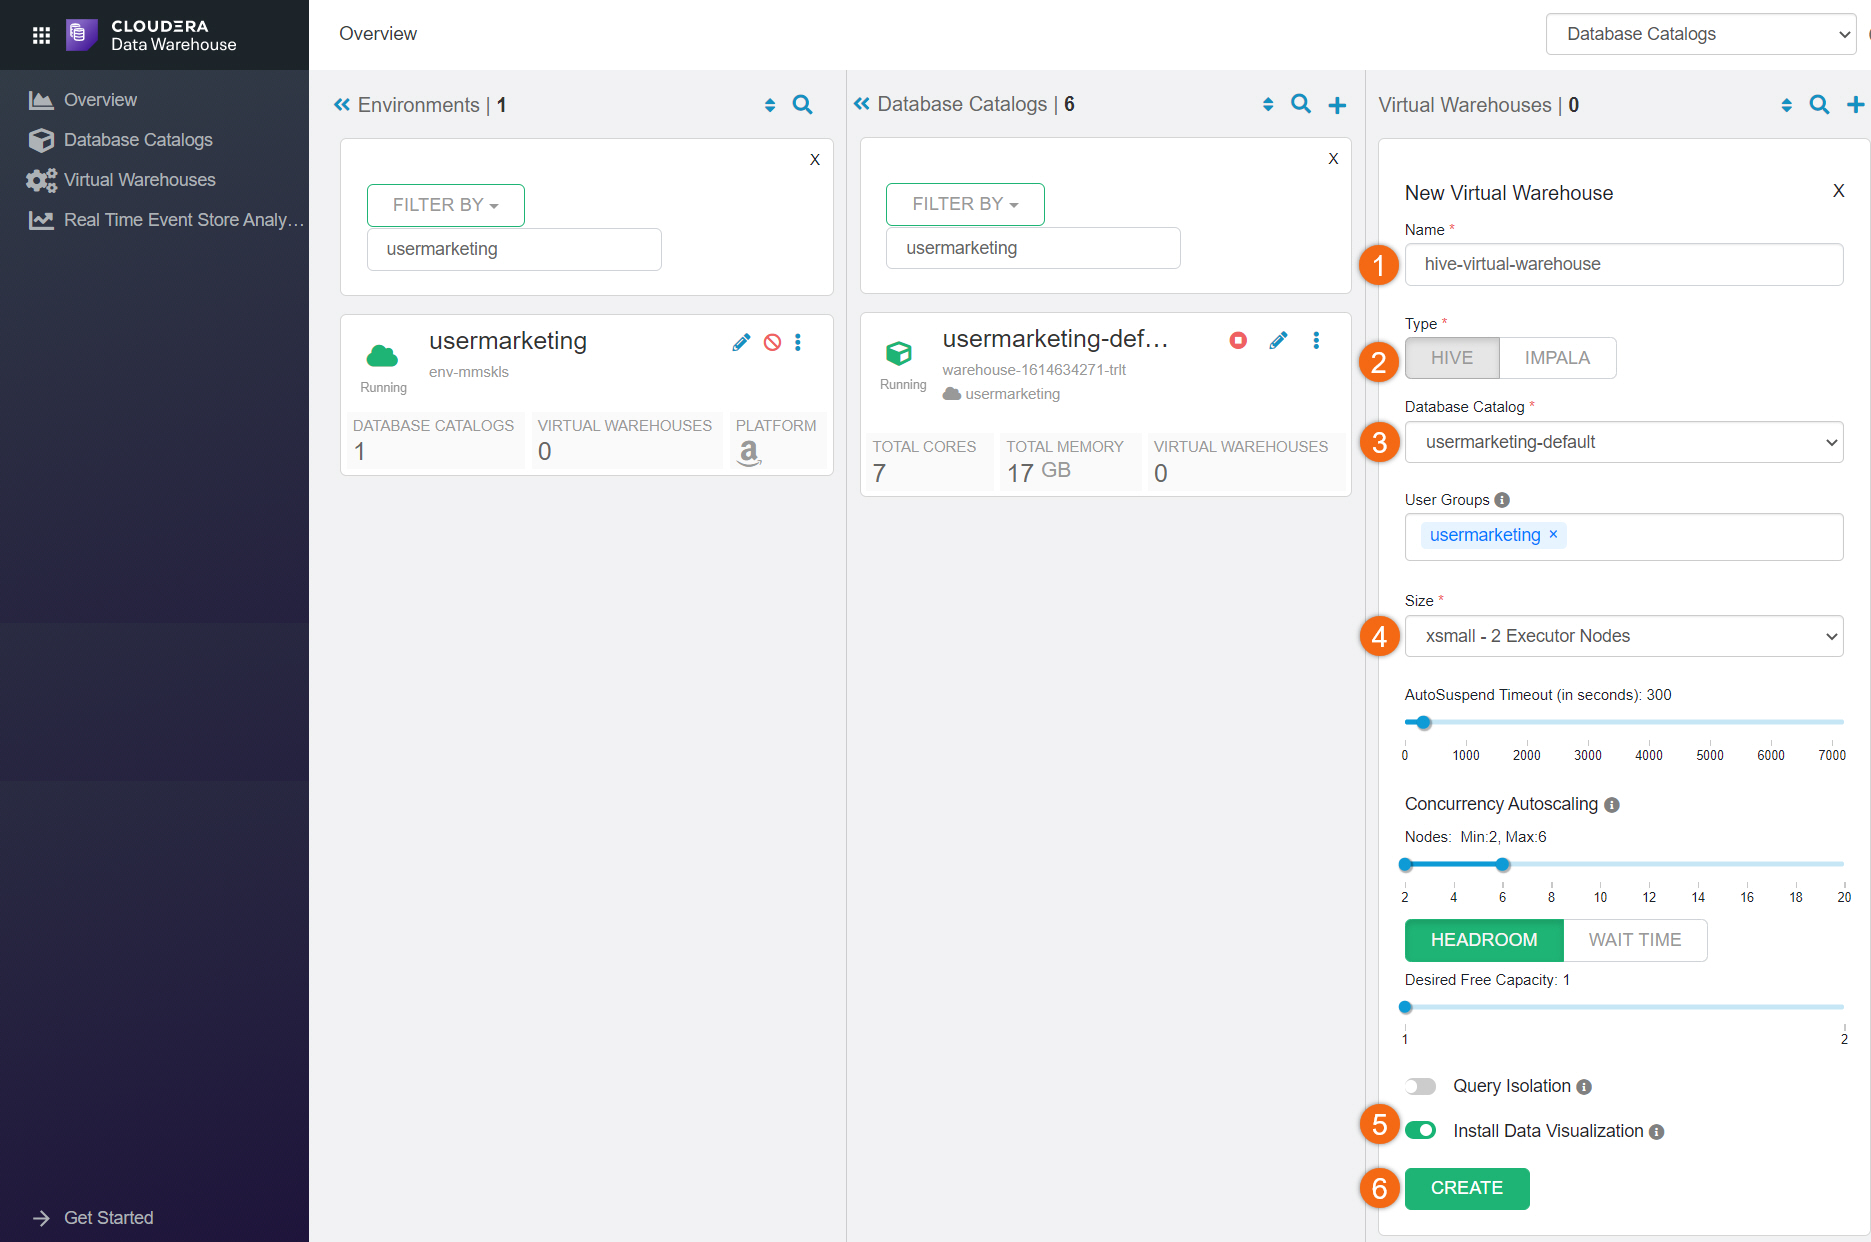
In the Virtual Warehouse section, click on ![]() to create a virtual warehouse:
to create a virtual warehouse:
- Name: hive-virtual-warehouse
- Type: HIVE
- Database Catalog: environment-default
- Size: xsmall
- Install Data Visualization
- CREATE
Create table and views
We will use Cloudera Data Explorer (formerly Hue) to create our table and views. The views will help us later when we create visual reports using Cloudera Data Visualization.
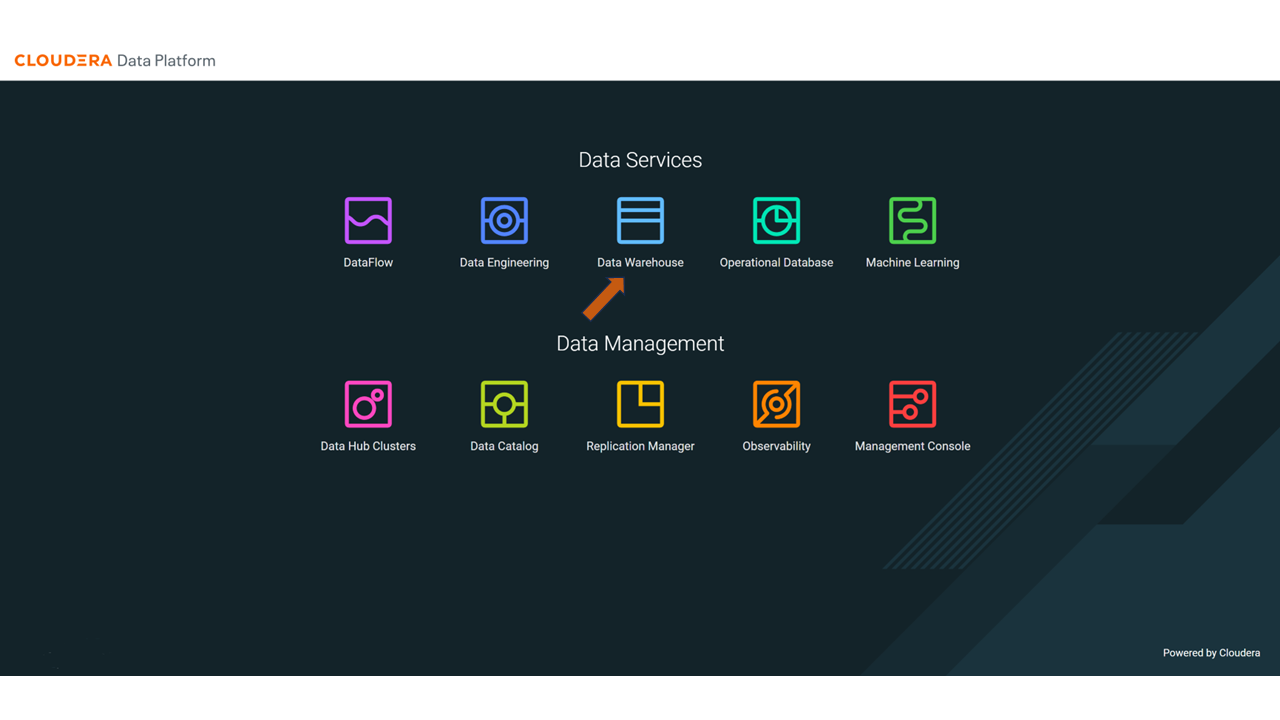
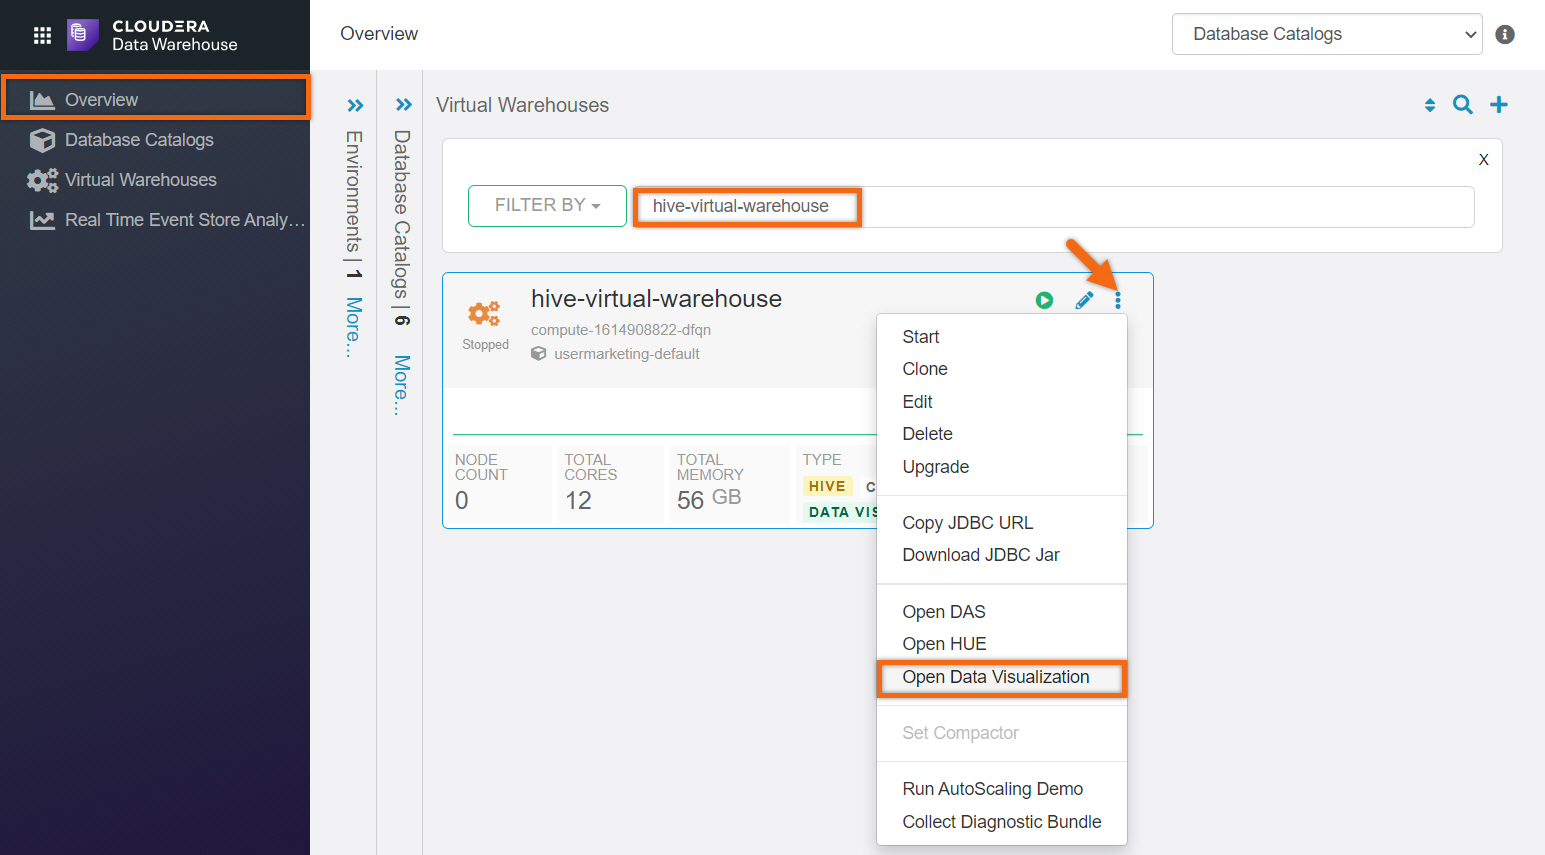
Beginning from the Cloudera Home Page, select Data Warehouse
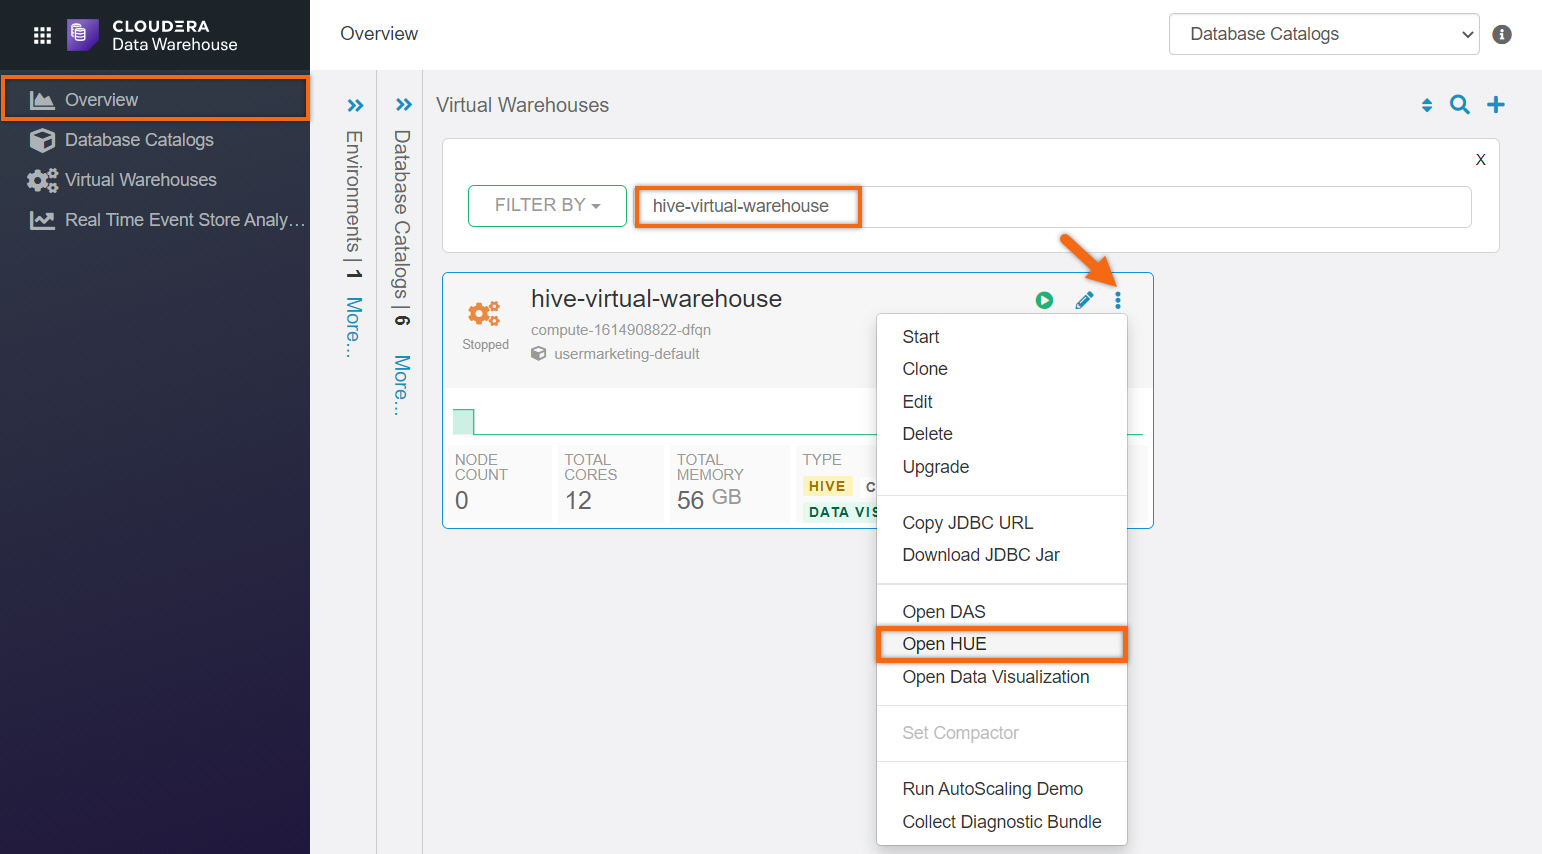
- Click on Overview
- Search for your Virtual Warehouse,
hive-virtual-warehouse - Click on

- Open Cloudera Data Explorer
We’ve included file create-table.sql in download assets. It contains all SQL statements needed for this tutorial. For your convenience, we’ve also provided it below.
IMPORTANT: You must update <S3BUCKET> with the location of dataset and remove comment tag.
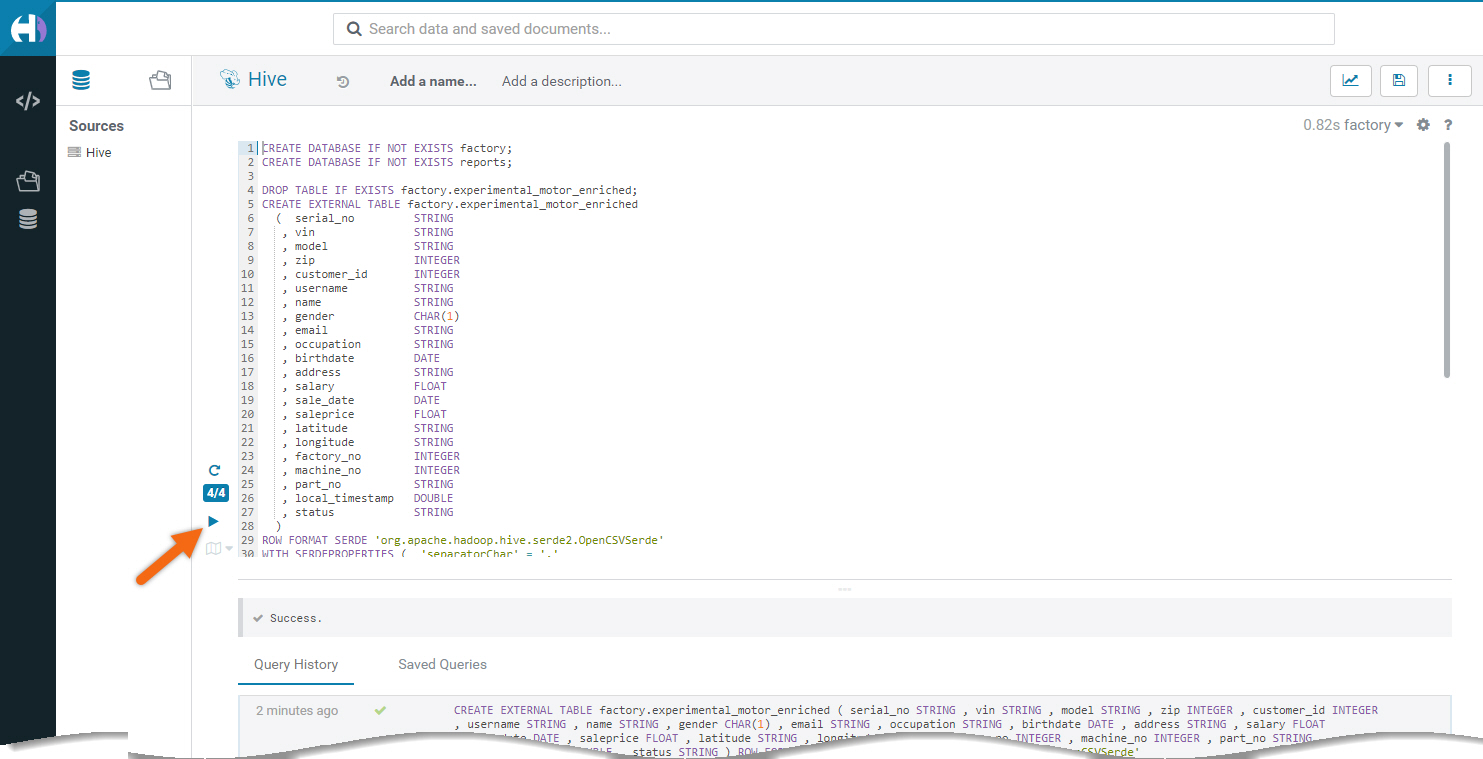
Enter and run the following SQL statements in the Cloudera Data Explorer editor:
CREATE DATABASE IF NOT EXISTS factory;
CREATE DATABASE IF NOT EXISTS reports;

DROP TABLE IF EXISTS factory.experimental_motor_enriched;
CREATE EXTERNAL TABLE factory.experimental_motor_enriched
  (  serial_no         STRING
   , vin               STRING
   , model             STRING
   , zip               INTEGER
   , customer_id       INTEGER
   , username          STRING
   , name              STRING
   , gender            CHAR(1)
   , email             STRING
   , occupation        STRING
   , birthdate         DATE
   , address           STRING
   , salary            FLOAT
   , sale_date         DATE
   , saleprice         FLOAT
   , latitude          STRING
   , longitude         STRING
   , factory_no        INTEGER
   , machine_no        INTEGER
   , part_no           STRING
   , local_timestamp   DOUBLE
   , status            STRING
  )
ROW FORMAT SERDE 'org.apache.hadoop.hive.serde2.OpenCSVSerde'
WITH SERDEPROPERTIES (  'separatorChar' = ','
                      , 'quoteChar'  = '"')
-- IMPORTANT: Update <S3BUCKET> with the location of dataset and remove comment tag.
-- LOCATION '<S3BUCKET>'
tblproperties('skip.header.line.count' = '1');


-- LIST OF ALL BETA ENGINES
CREATE VIEW reports.beta_engines AS
  SELECT model, latitude, longitude
    FROM factory.experimental_motor_enriched;


-- RECALL NEEDED:
-- Parts created BETWEEN October 22 and October 24 were found
-- to be defective and need to be recalled.
CREATE VIEW reports.beta_engine_recall AS
  SELECT sale_date, model, vin, name, address, latitude, longitude
    FROM factory.experimental_motor_enriched
    WHERE sale_date BETWEEN CAST('2020-10-22' AS DATE) AND CAST('2020-10-24' AS DATE)
    ORDER BY sale_date DESC;
Create dashboard using Cloudera Data Visualization
Beginning from the Cloudera Home Page, select Data Warehouse
- Click on Overview
- Search for your Virtual Warehouse,
hive-virtual-warehouse - Click on

- Open Data Visualization
NOTE: You may need to logon using your Cloudera platform workload userid/password.
Create datasets
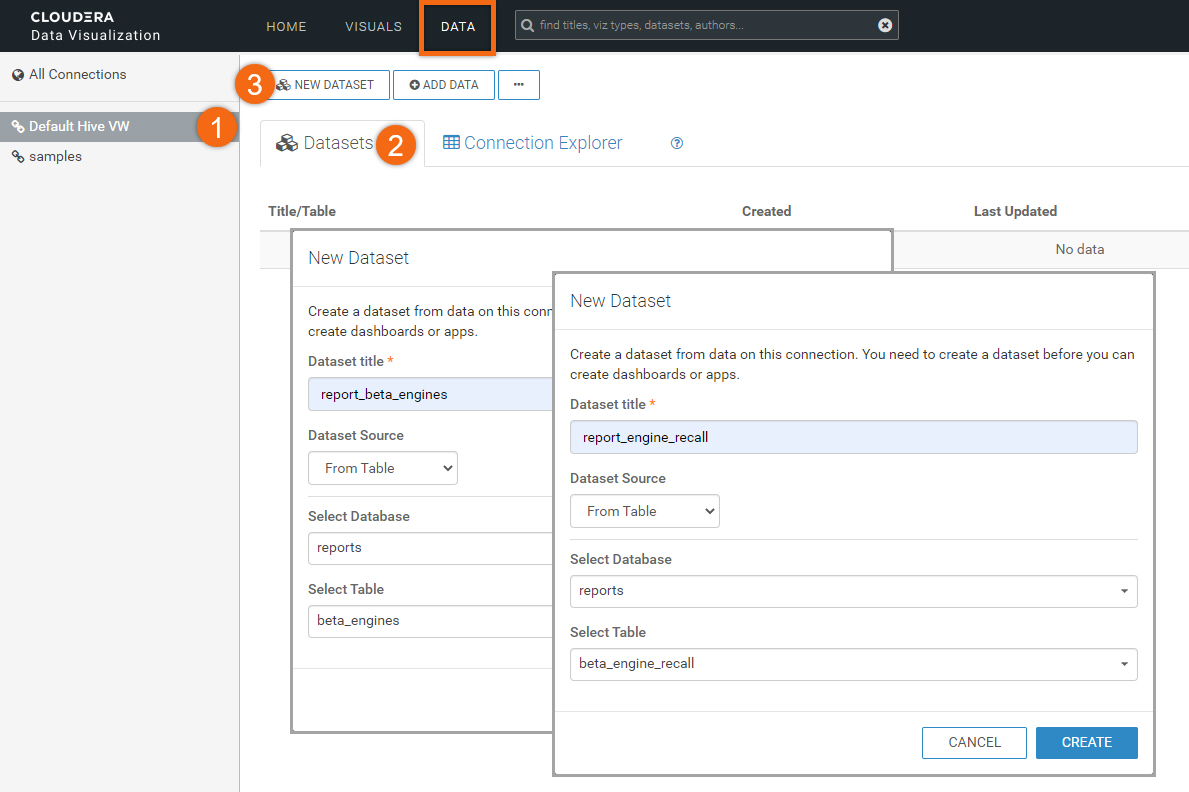
Starting from the Data Visualization home page, select DATA.
Select Default Hive VW connection
Select Datasets tab
Select NEW DATASET
Create dataset(s) from the following tables:
Dataset Title: report_beta_engines
Dataset Source: From Table
Select Database: reports
Select Table: beta_engines
Dataset Title: report_engine_recall
Dataset Source: From Table
Select Database: reports
Select Table: beta_engine_recall

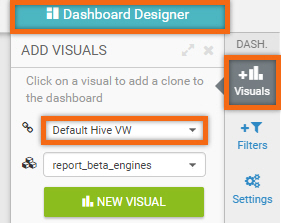
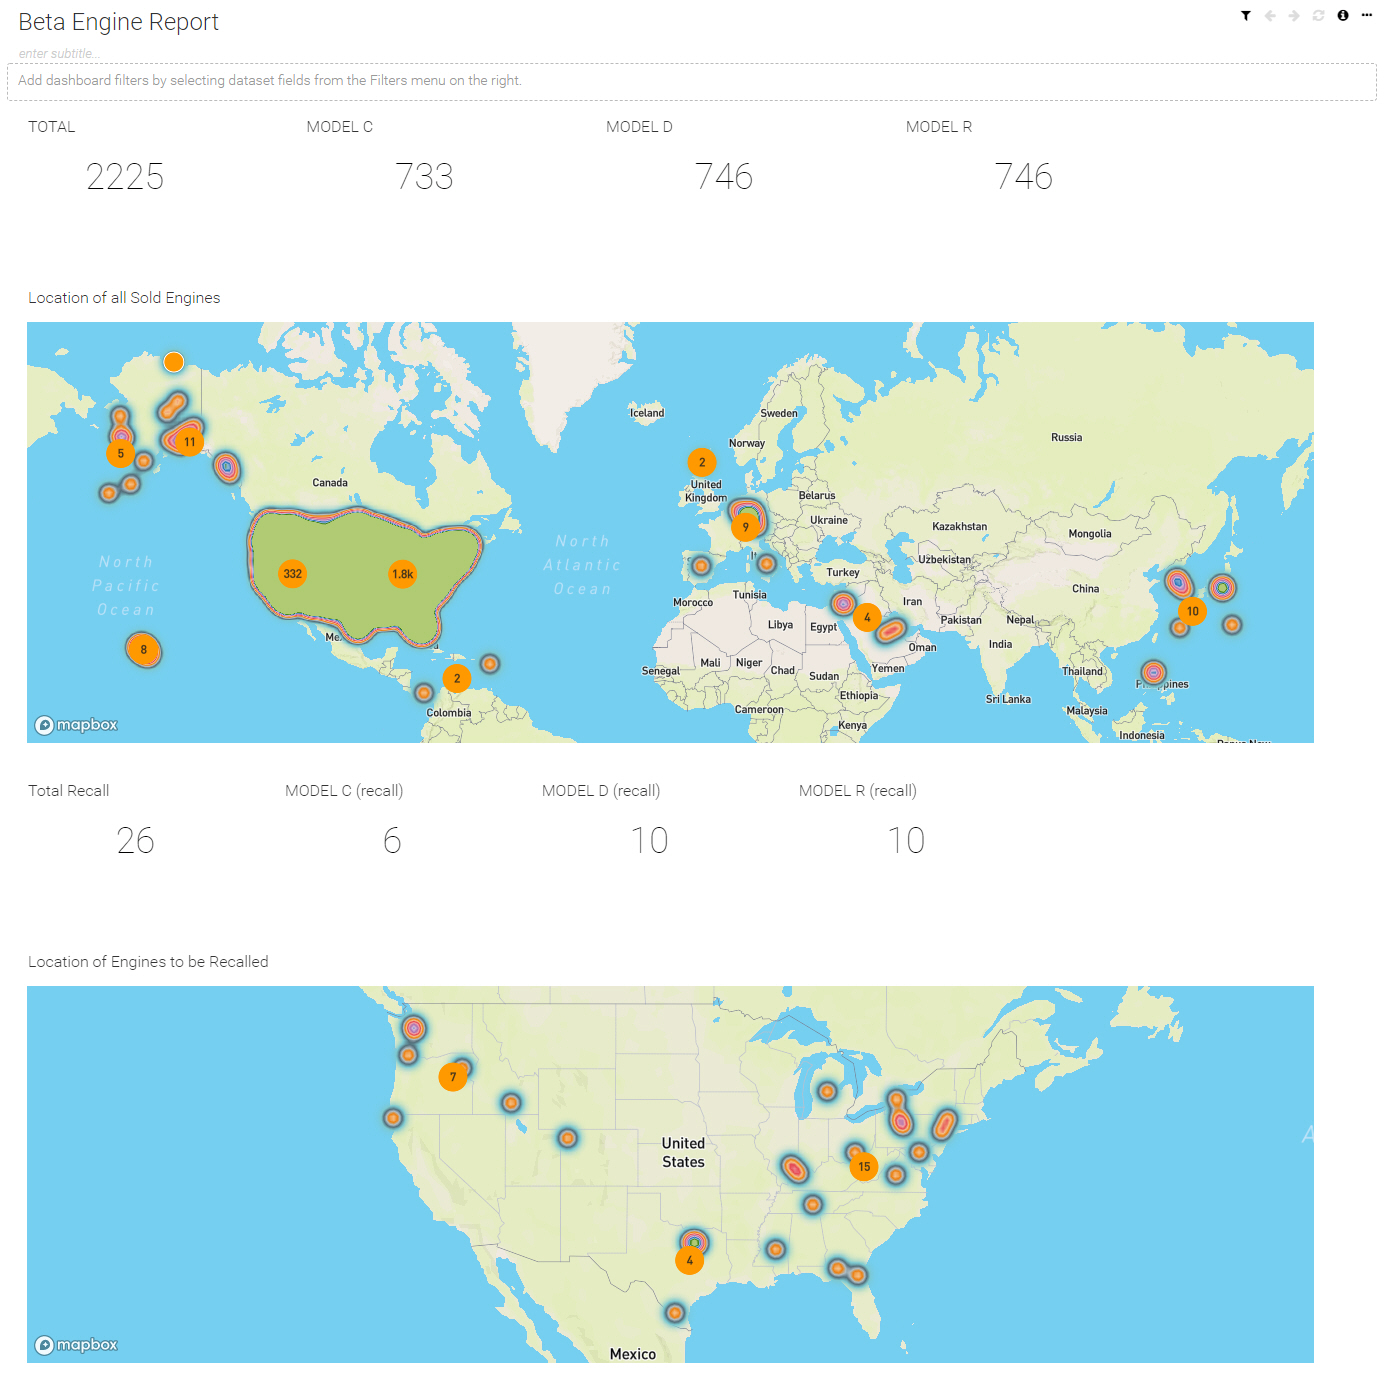
Let’s use Beta Engine Report for the title of this dashboard.
In the Dashboard Designer, select Visuals tab. We are going to create several visuals using data connection Default Hive VW.
Create five (5) visuals using dataset report_beta_engines:
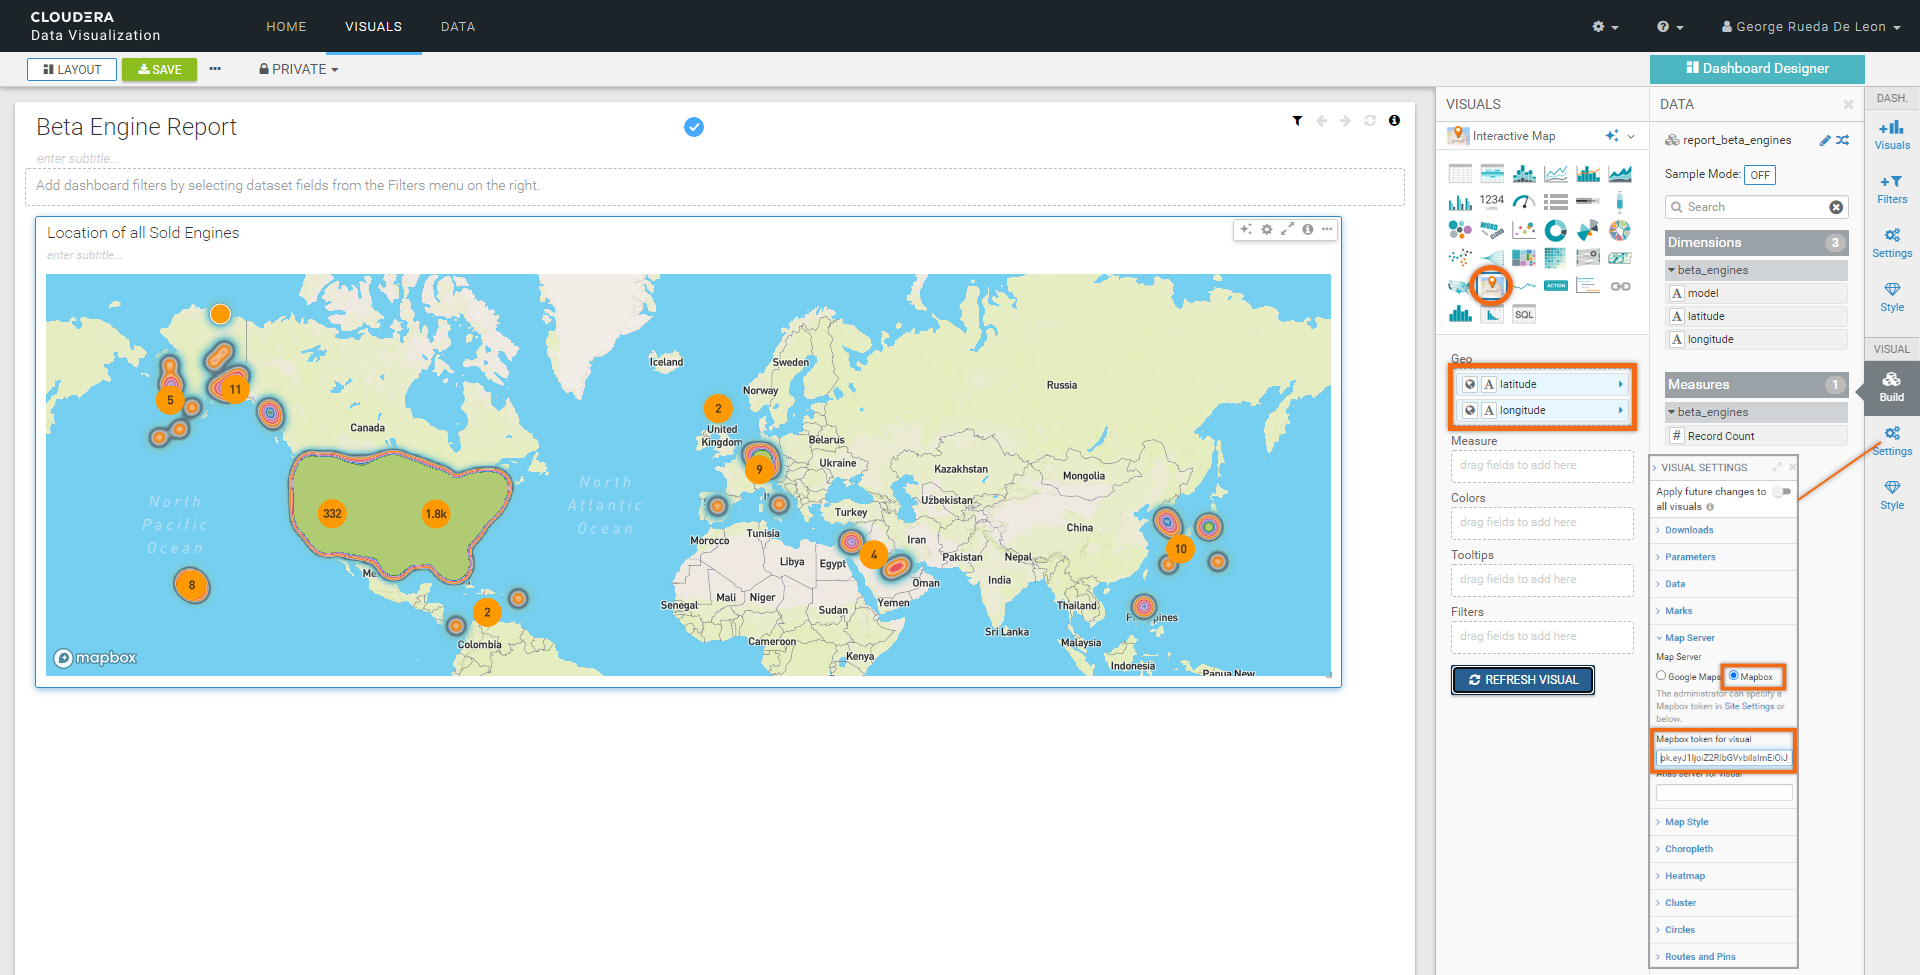
Title: Location of all Sold Engines
Build Tab:
Graph Type: Interactive Map
Geo: latitude, longitude
Important: You need to have Mapbox token to use Interactive Map. If you receive a Mapbox Token Error, you may create your own from mapbox.com and setup as follows:
Settings Tab:
Map Server > Mapbox > Mapbox token for visual: token provided by Mapbox
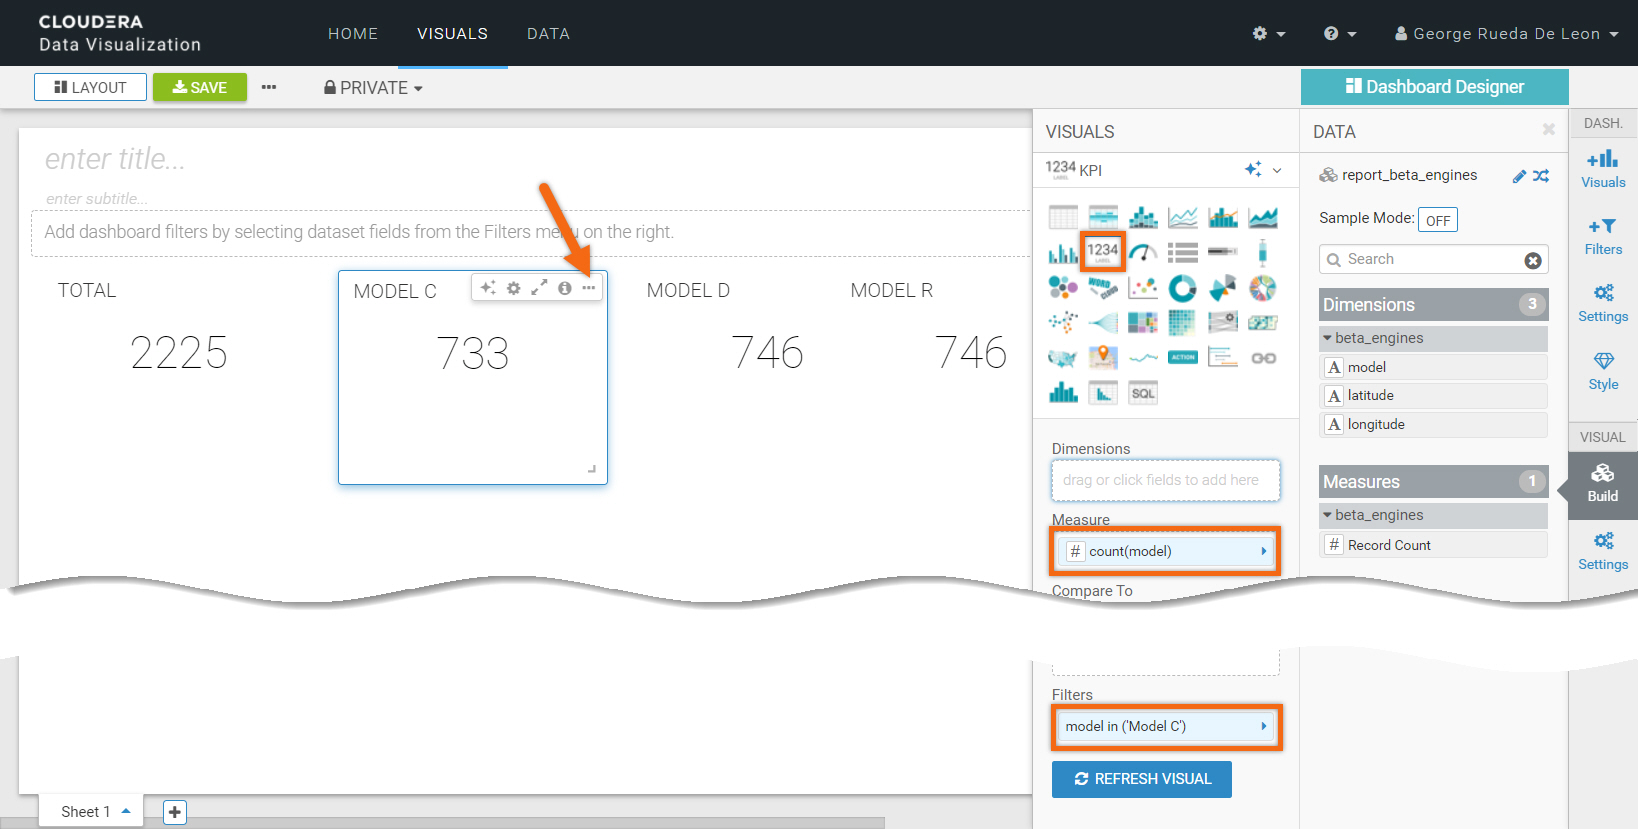
Title: TOTAL
Build Tab:
Graph Type: KPI
Measure: count(model)
The next three (3) visuals can be created just as you have been. Since they are similar to the previous, we will clone it and modify it as needed.
Click on ![]() and select Clone.
and select Clone.
Title: MODEL C
Build Tab:
Graph Type: KPI
Measure: count(model)
Filters: model in (‘Model C’)
Title: MODEL D
Build Tab:
Graph Type: KPI
Measure: count(model)
Filters: model in (‘Model D’)
Title: MODEL R
Build Tab:
Graph Type: KPI
Measure: count(model)
Filters: model in (‘Model R’)
Create five (5) visuals using dataset report_engine_recall:
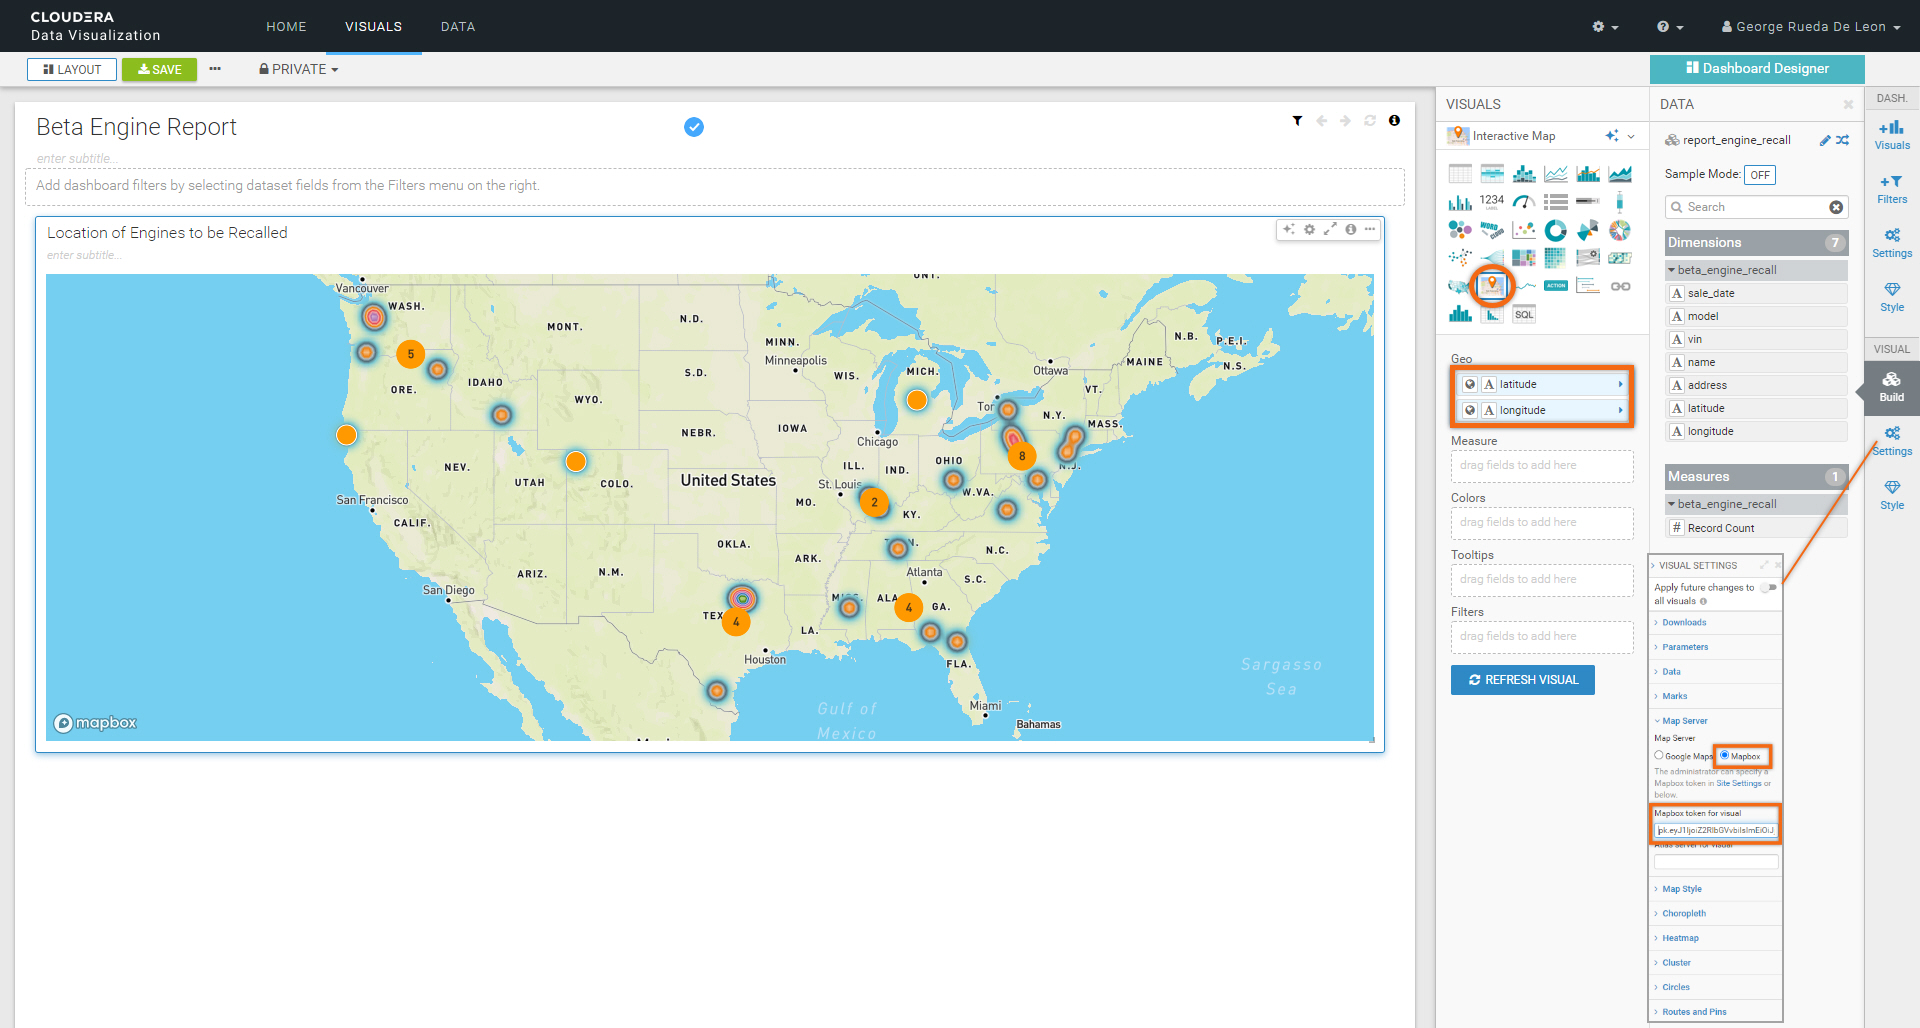
Title: Location of Engines to be Recalled
Build Tab:
Graph Type: Interactive Map
Geo: latitude, longitude
Important: You need to have Mapbox token to use Interactive Map. If you receive a Mapbox Token Error, you may create your own from mapbox.com and setup as follows:
Settings Tab:
Map Server > Mapbox > Mapbox token for visual: token provided by Mapbox
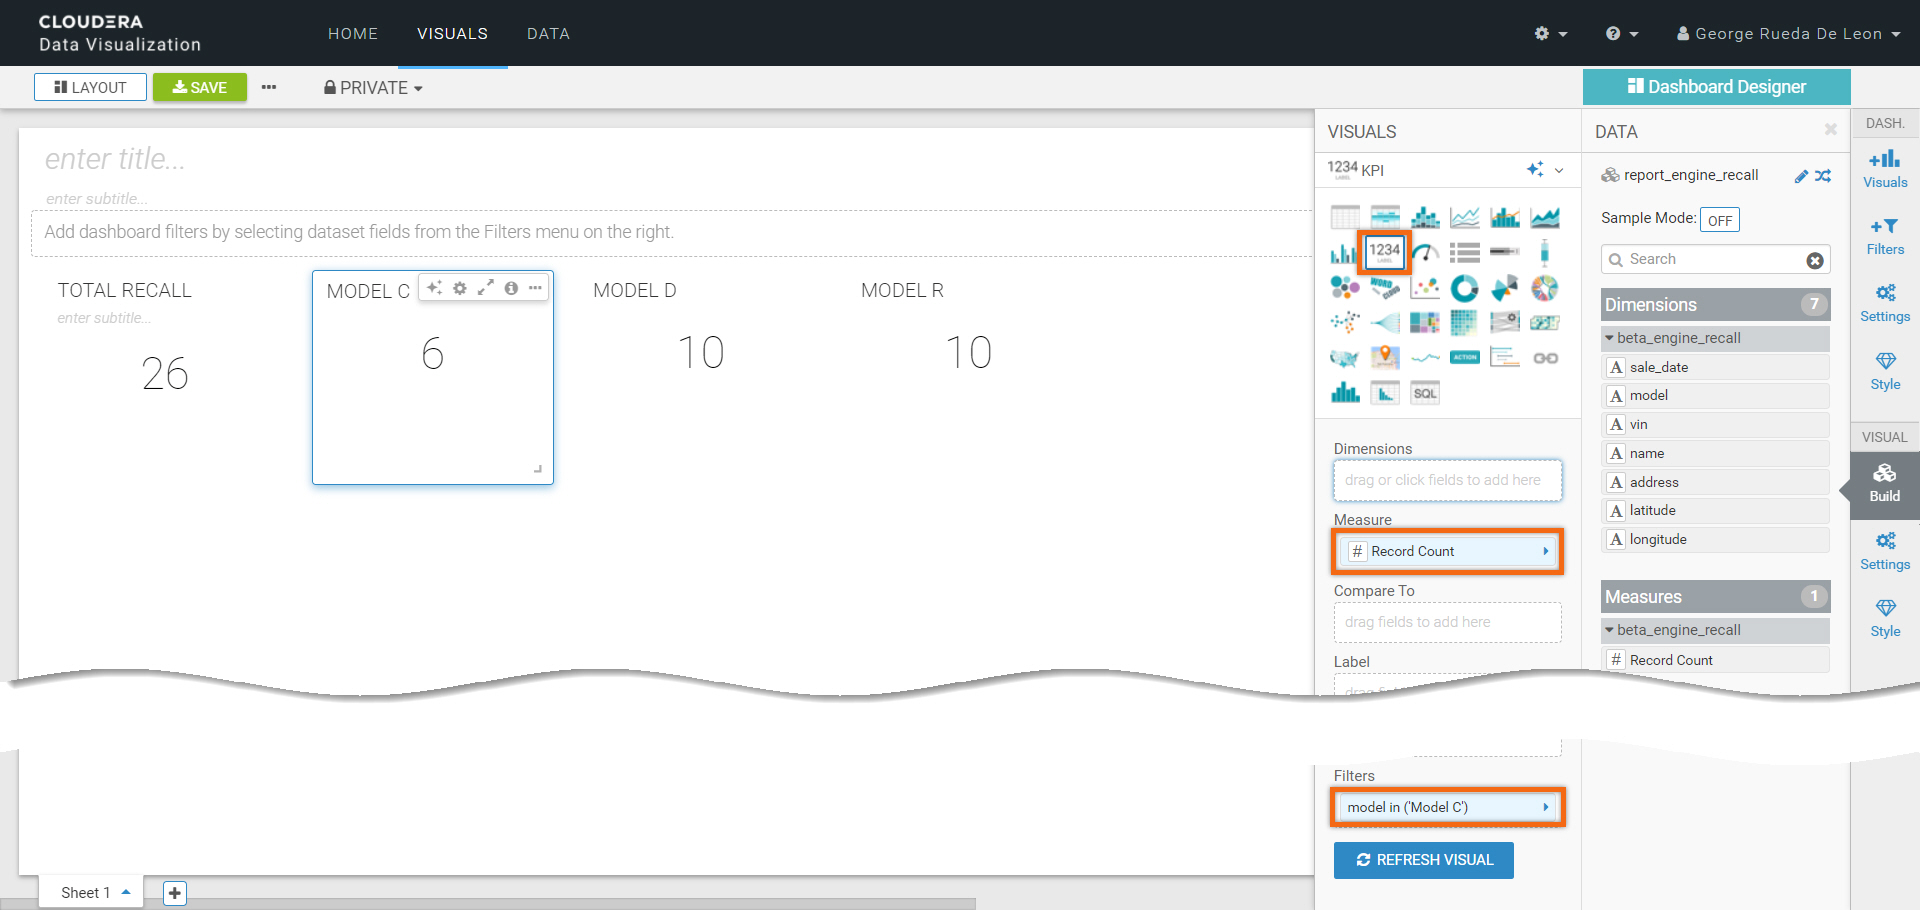
Title: TOTAL RECALL
Build Tab:
Graph Type: KPI
Measure: #Record Count
The next three (3) visuals can be created just as you have been. Since they are similar to the previous, we will clone it and modify it as needed.
Click on ![]() and select Clone.
and select Clone.
Title: MODEL C
Build Tab:
Graph Type: KPI
Measure: #Record Count
Filters: model in (‘Model C’)
Title: MODEL D
Build Tab:
Graph Type: KPI
Measure: #Record Count
Filters: model in (‘Model D’)
Title: MODEL R
Build Tab:
Graph Type: KPI
Measure: #Record Count
Filters: model in (‘Model R’)
We are done creating our dashboard. To save it, click on SAVE.
It should look like the following:
Summary
Congratulations on completing the tutorial.
You explored a small subset of services that Cloudera has to offer:
- Cloudera Data Warehouse (Hive and Cloudera Data Explorer)
- Cloudera Data Visualization
As you have experienced, it was easy to analyze datasets and create beautiful reports using Cloudera Data Visualization.


