Introduction
In this tutorial we’ll analyze datasets using Cloudera Data Warehouse on Cloudera on cloud. We will also visualize our data using Cloudera Data Visualization.
We will be looking at a synthetic data set for a mock company that has various high-tech factories across the world. It was recently noticed that there's been a downturn in revenue for the current fiscal year. We've been tasked to dig into the data to try and find any potential causes as to why this may be.
Prerequisites
- Have access to Cloudera on cloud with predefined Cloudera Data Engineering Virtual Cluster
- Have created a Cloudera workload User
- Ensure proper Cloudera Data Engineering role access
- DEUser: access virtual cluster and run jobs
- Basic AWS CLI skills
Download assets
You have two (2) options to get the assets needed for this tutorial:
It contains only necessary files used in this tutorial. Unzip tutorial-files.zip and remember its location.
It provides assets used in this and other tutorials; organized by tutorial title.
Using AWS CLI, copy the following data files to your S3 bucket, defined by your environment’s storage.location.base attribute:
daily_employee_logs_export.csv
employee_metadata_export.csv
employee_sicktime_export.csv
employee_vacation_export.csv
factory_ambient_export.csv
factory_revenue_export.csv
machine_throughput_export.csv
machine_uptime_export.csv
Note: You may need to ask your environment's administrator to get property value for storage.location.base.
For example, property storage.location.base has value s3a://usermarketing-cdp-demo, therefore we will copy the files using the command:
aws s3 cp . s3://usermarketing-cdp-demo/ --recursive --exclude "*" --include "*.csv"

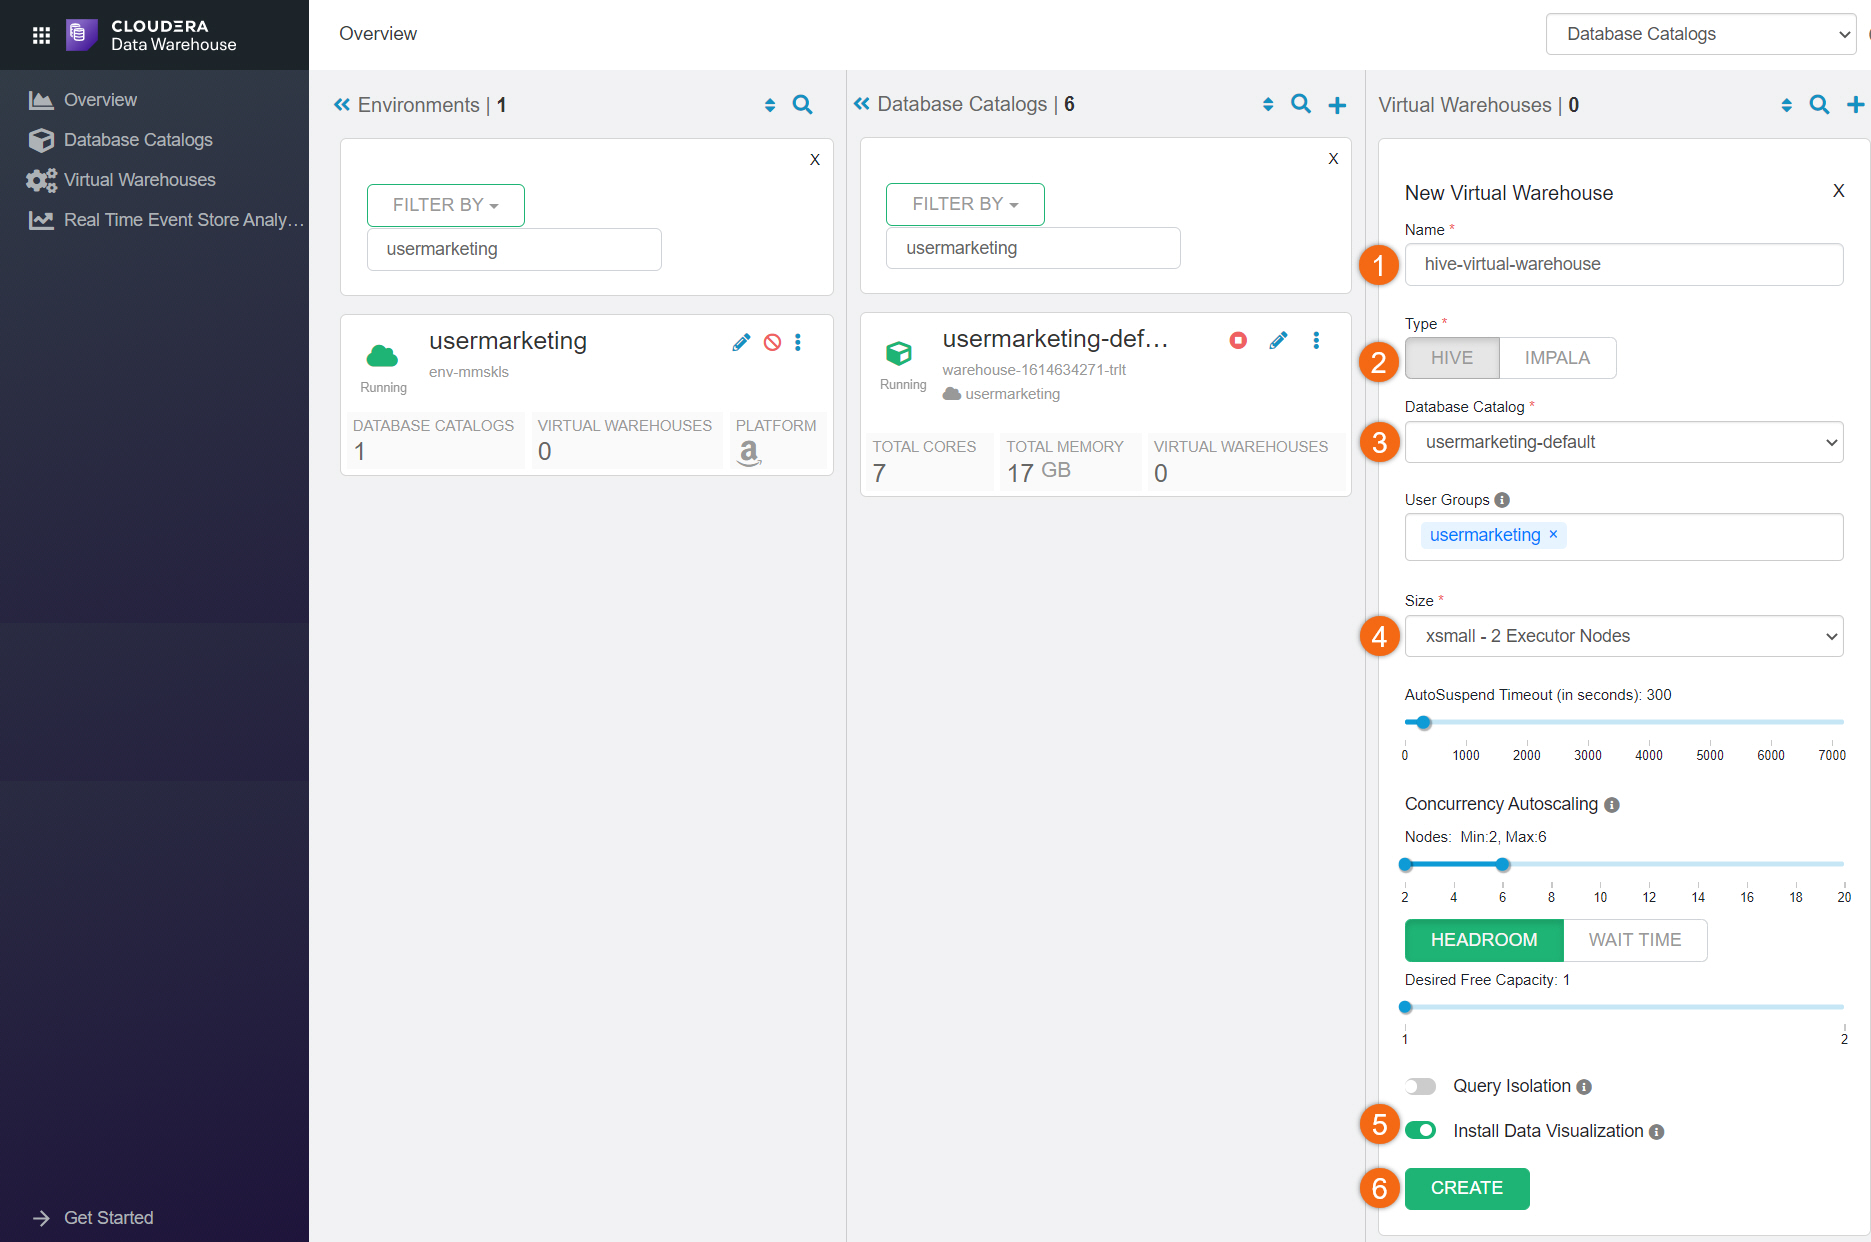
Create an Impala Virtual Warehouse
Before we create a virtual warehouse, we need to make sure your environment is activated and running.
Beginning from Cloudera Home Page, select Data Warehouse.
If you see ![]() next to the environment name, no need to activate it because it's already been activated and running.
next to the environment name, no need to activate it because it's already been activated and running.
Otherwise, click on ![]() to activate the environment. This will create a default database catalog named <environment_name>-default.
to activate the environment. This will create a default database catalog named <environment_name>-default.
In the Virtual Warehouse section, click on ![]() to create a virtual warehouse:
to create a virtual warehouse:
- Name:
Mock-Company - Type: IMPALA
- Virtual Warehouse Catalog: environment_name-default
- Virtual Warehouse Size: XSMALL
- Install Data Visualization
- CREATE
Introduction to Cloudera Data Explorer (formerly Hue)
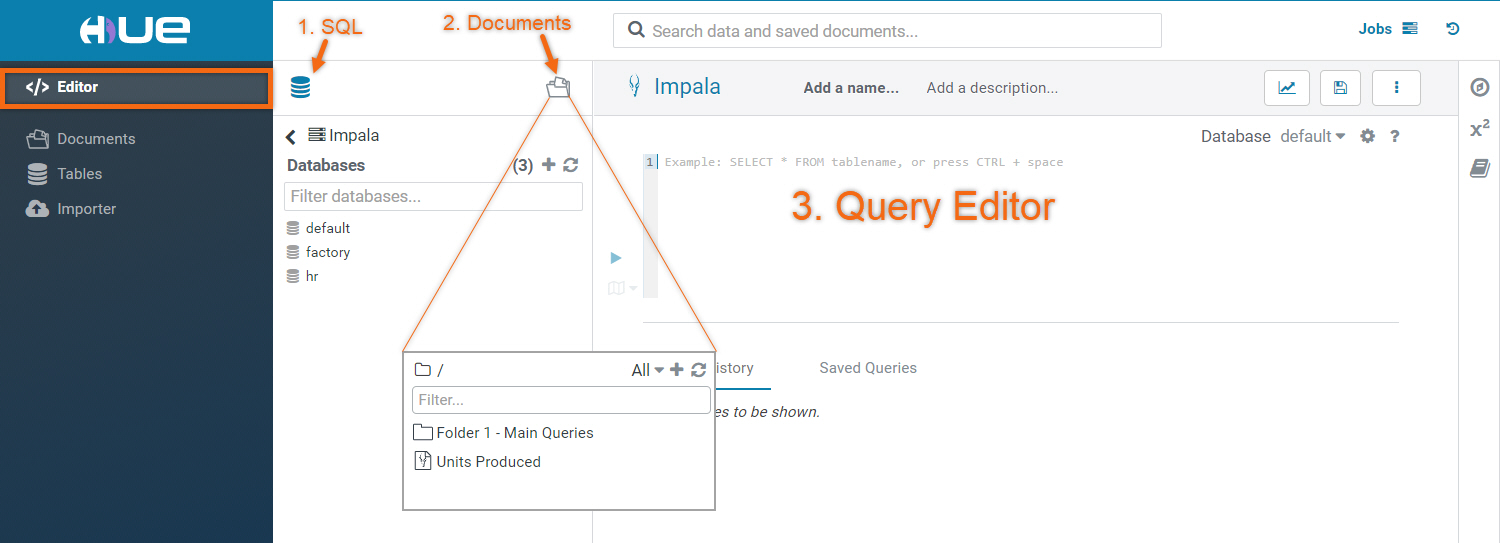
Cloudera Data Explorer is a web-based interactive query editor that enables you to interact with databases and data warehouses.
Most commonly used interface is Editor:
- Selecting SQL icon
 will display all existing database objects.
You can get more detailed information by selecting on the object (i.e. database, table, view). - Selecting Documents
 will display all save queries
 - Type a query in the editor panel and click the run icon
 to run the query.
Run Spark job using Cloudera Data Engineering
You must already have a Cloudera Data Engineering Virtual Cluster created. Refer to Getting Started with Cloudera Data Engineering on Cloudera to learn how.
Included in Download Assets is file ingest_CDE.py. This PySpark job will ingest daily logs for machine efficiency, ambient weather conditions and employee data. It will create two (2) Impala databases, HR and FACTORY with its corresponding tables.
NOTE: Before running the job, we need to modify one (1) variable in ingest_CDE.py. Update variable s3BucketName using storage.location.base attribute; defined by your environment.
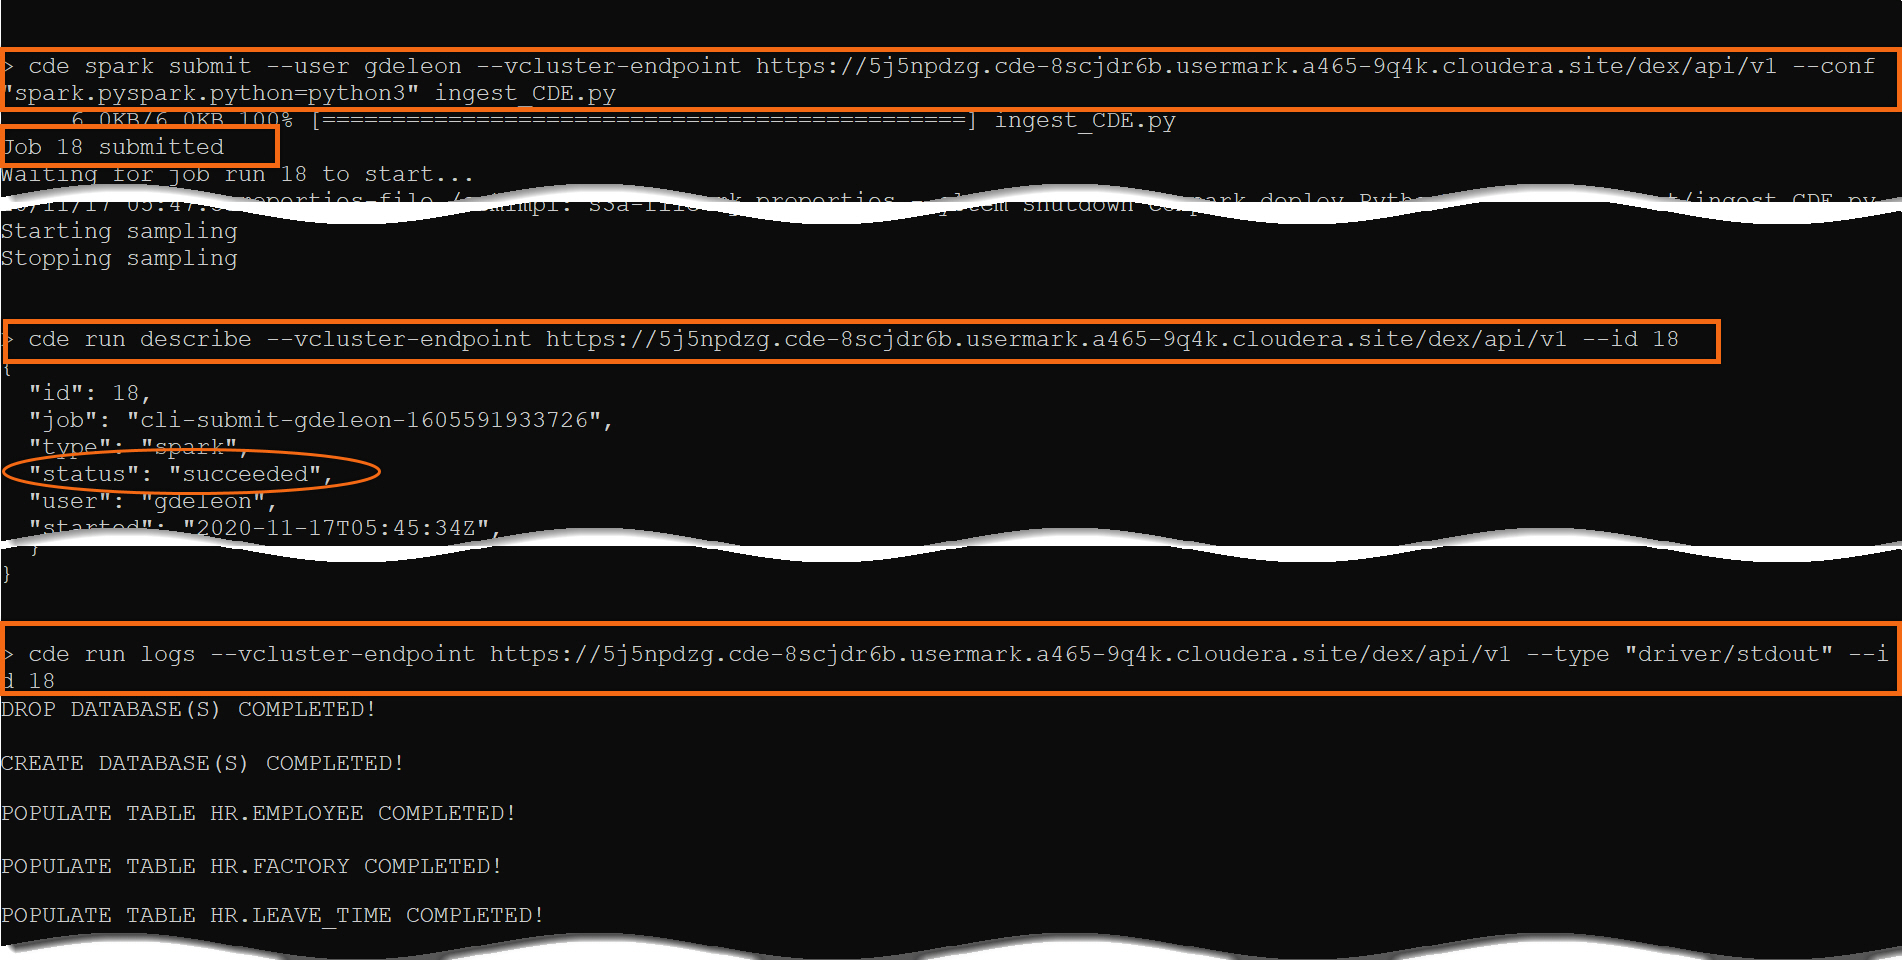
Let’s run this file using Cloudera Data Engineering command line interface (CLI).
Run Spark Job:
cde spark submit --user <user> --vcluster-endpoint <virtual cluster endpoint> --conf "spark.pyspark.python=python3" ingest_CDE.py
Check Job Status:
cde run describe --vcluster-endpoint <virtual cluster endpoint> --id #, where # is the job id
Review the Output:
cde run logs --vcluster-endpoint <virtual cluster endpoint> --type "driver/stdout" --id #, where # is the job id
NOTE: Replace <virtual cluster endpoint> with JOBS API URL provided in Cluster Details.
Run Queries for Insights
Query 1 - Factory Performance
-- Query 1 - Factory Performance
-- Factory Unit Production
DROP VIEW IF EXISTS factory.v_units_prod;

CREATE VIEW factory.v_units_prod AS
    SELECT factory_id, machine_id, ROUND(AVG(daily_units_produced),0) AS avg_units_produced
      FROM factory.machine_throughput
      GROUP BY factory_id, machine_ID
      ORDER BY factory_id, machine_ID LIMIT 100;

SELECT * FROM factory.v_units_prod;


-- Factory Revenue
DROP VIEW IF EXISTS factory.v_revenue;

CREATE VIEW factory.v_revenue AS
    SELECT factory_id, sum(revenue) AS total_revenue
      FROM (  SELECT factory_id, (avg_units_produced * revenue_per_unit) AS revenue
                FROM factory.v_units_prod mt JOIN factory.machine_revenue mr
                  ON mt.machine_id = mr.machine_id
           ) AS v_rev
    GROUP by factory_id
    ORDER BY factory_id ASC LIMIT 100;

SELECT * FROM factory.v_revenue;
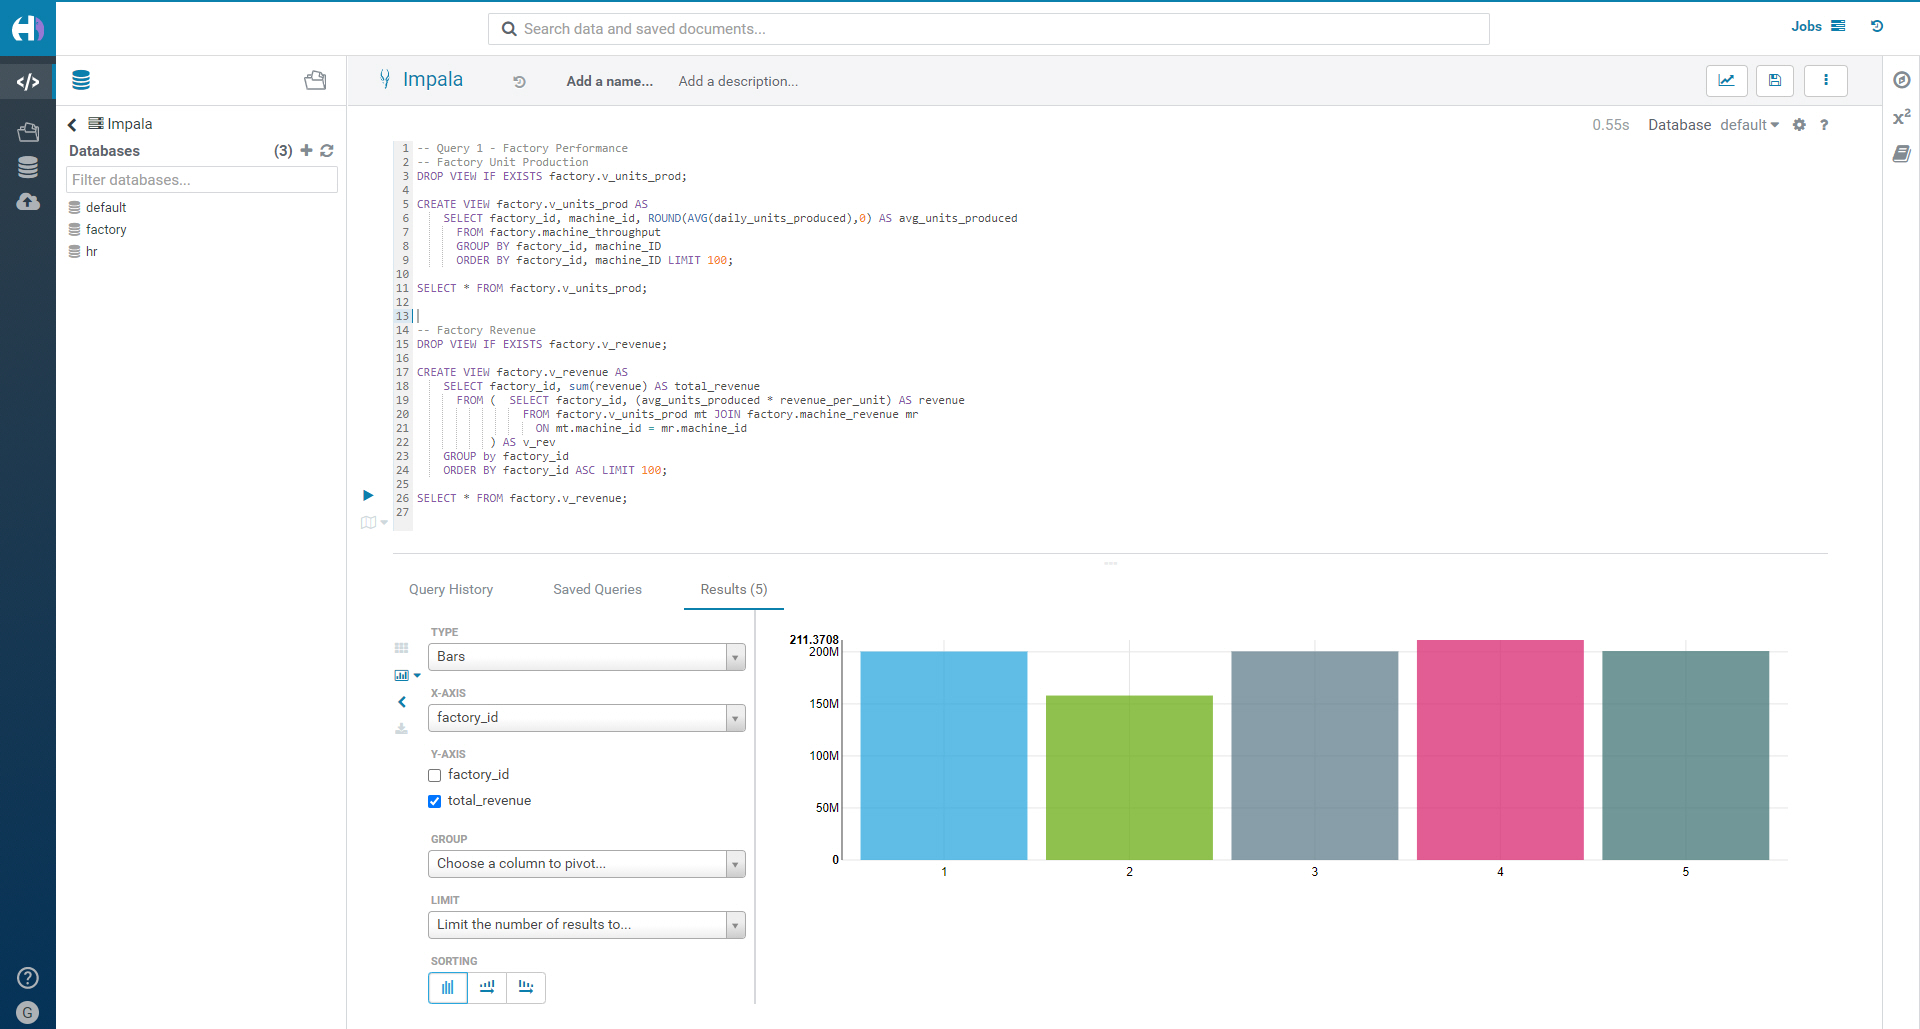
We have confirmed that there has been a decrease in both revenue and unit production. The culprit is factory 2.
Let’s run some queries to see if we can dig deeper and find some reasons as to why factory 2 could be showing a lower revenue.
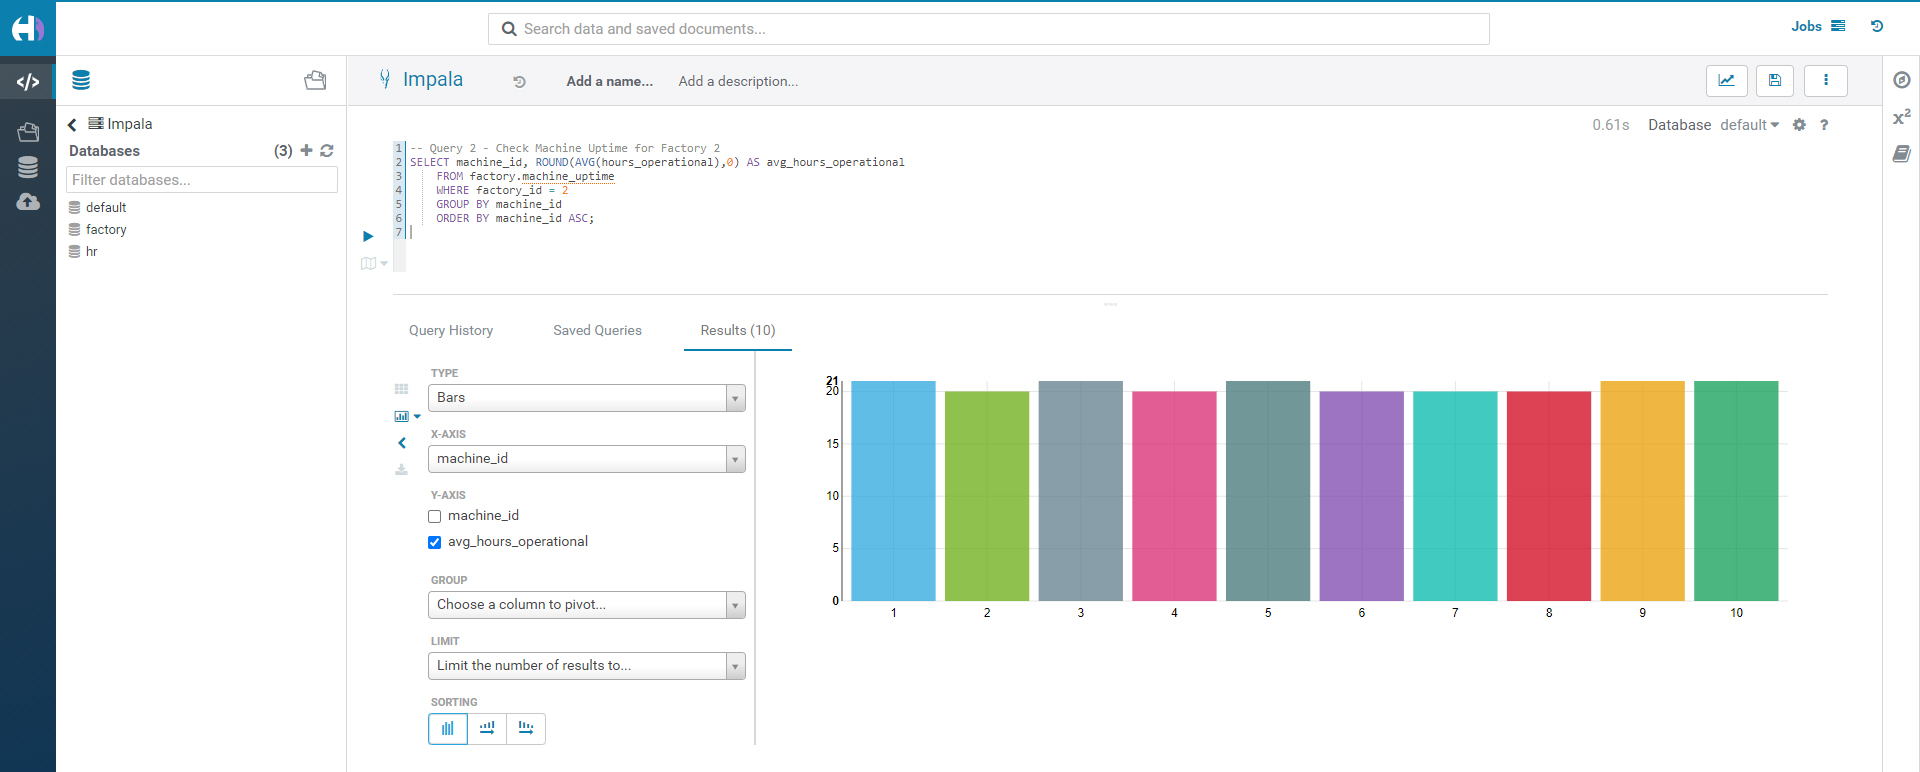
The machine uptime is roughly that same, which tells us we do not have a specific machine issue. Instead, this is a factory wide issue - more exploration is needed.
Since we have HR data, we can look there to see if there's any correlation in employee data that may explain the decreased revenue in factory 2.
Query 3 - Number of Hours Worked per Factory
SELECT factory_id, AVG(time_worked)
    FROM hr.timesheet
    GROUP BY factory_id
    ORDER BY factory_id ASC;
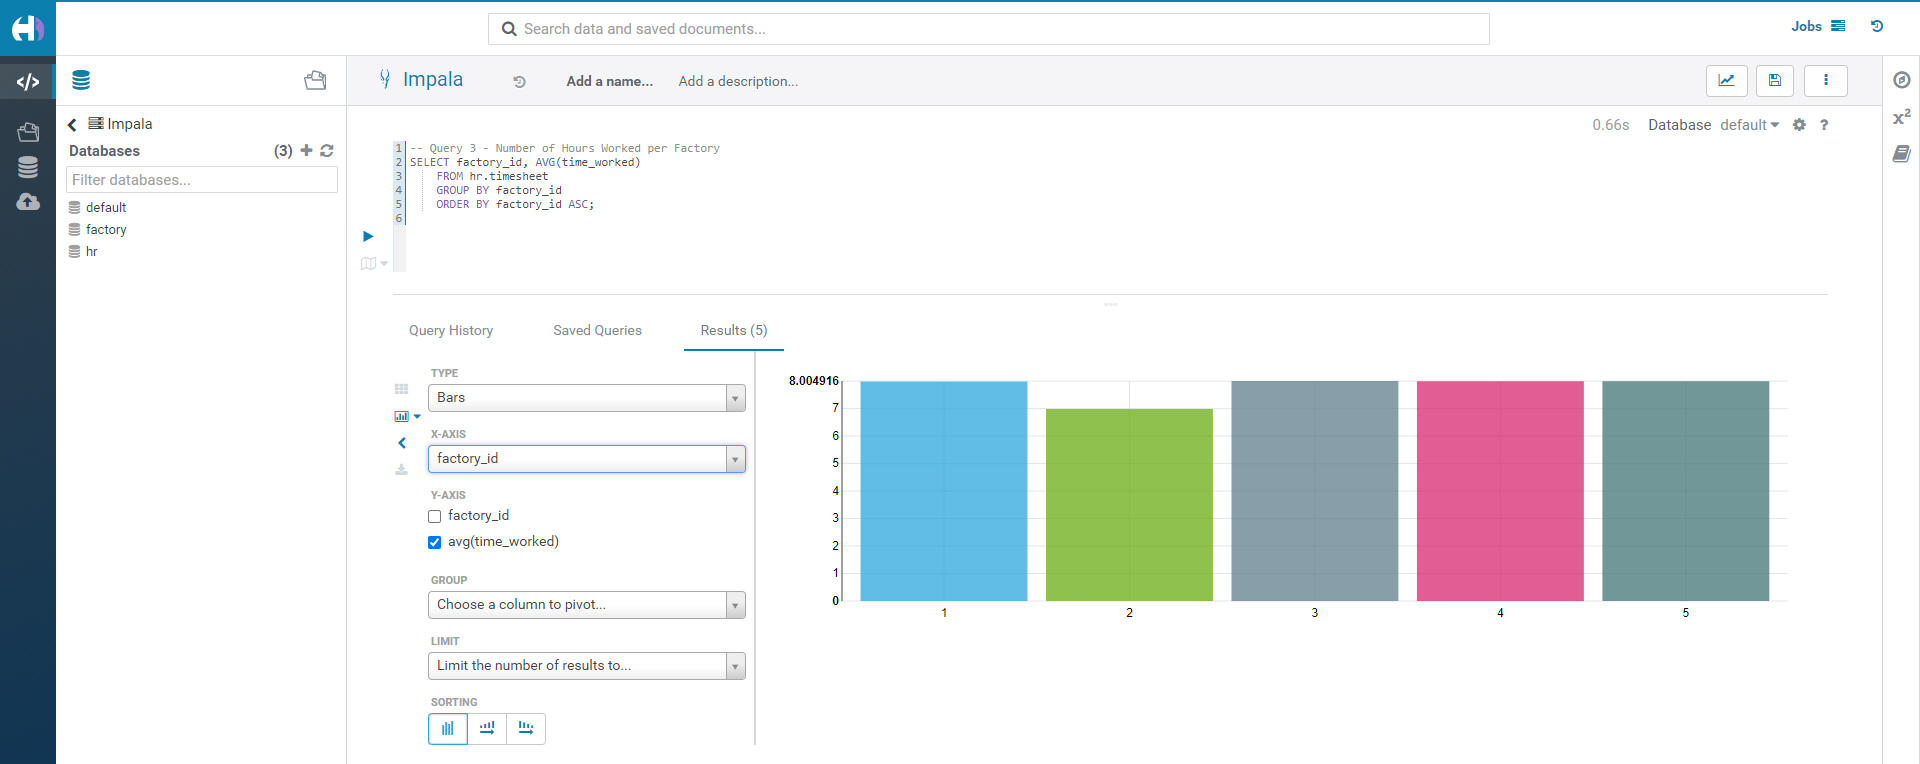
Factory 2 has the lowest number of hours worked. Let’s find out why.
Query 4 - Employee Leave Time Distribution Per Factory
DROP VIEW IF EXISTS hr.v_employee_leave_time;

CREATE VIEW hr.v_employee_leave_time AS
    SELECT factory_id, leave_type, COUNT(leave_type)/COUNT(DISTINCT employee_id) AS avg_time
      FROM hr.leave_time
      GROUP BY factory_id, leave_type
      ORDER BY factory_id ASC, leave_type DESC LIMIT 100;

SELECT * FROM hr.v_employee_leave_time;
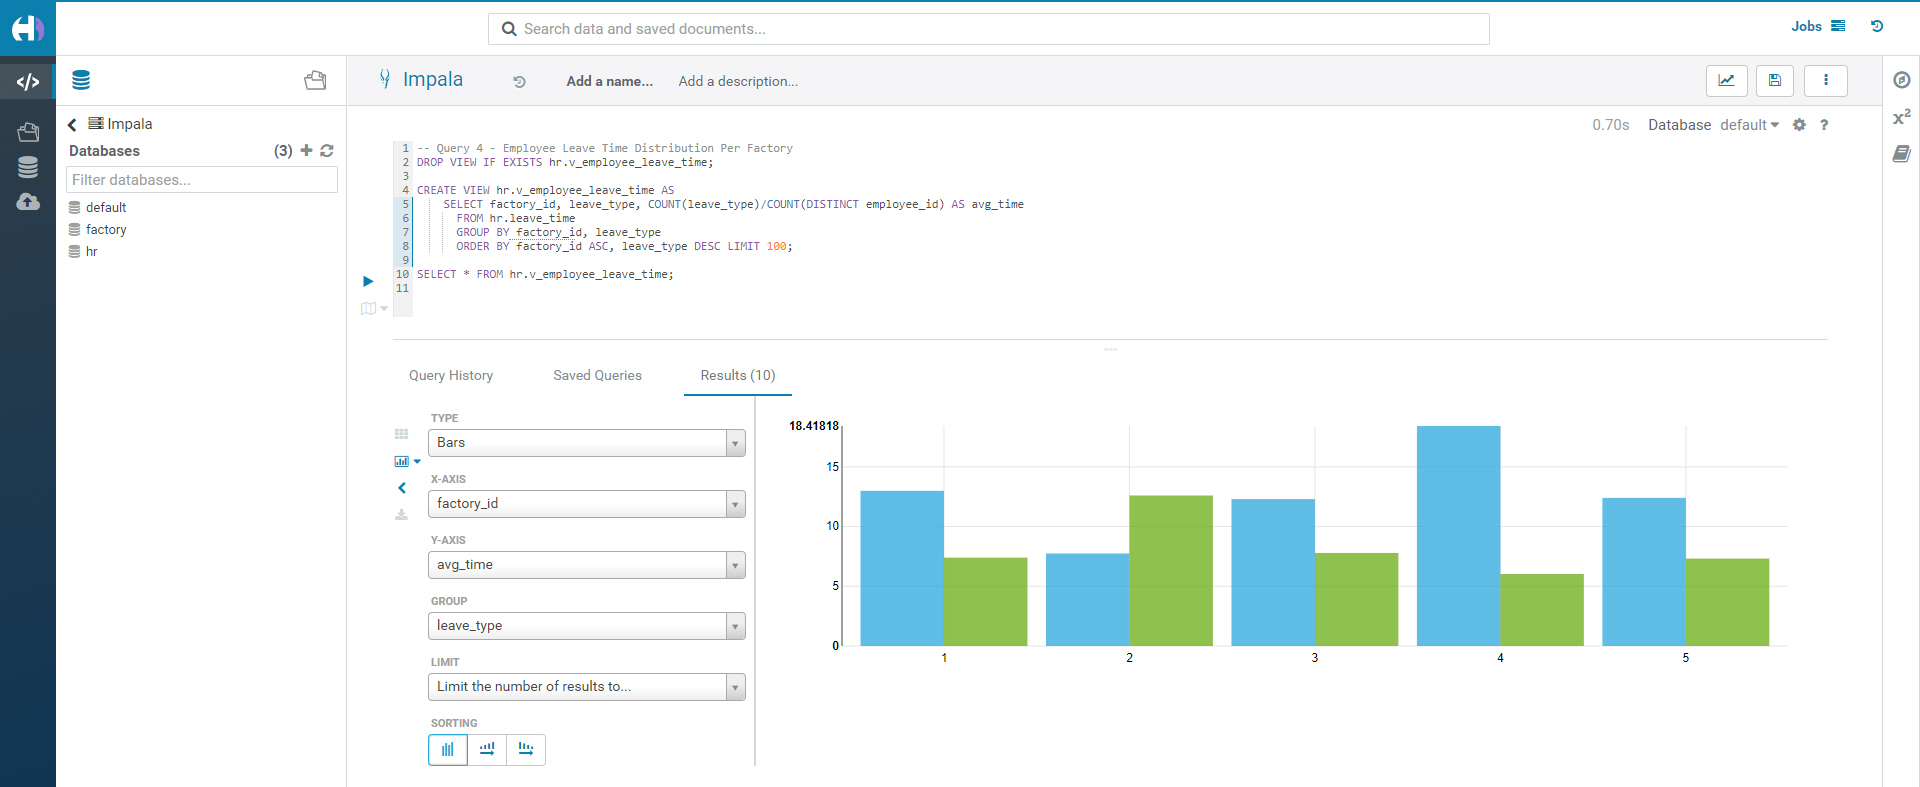
Employees in factory 2 have a higher number of sick days. It seems that unlike the other factories, factory 2 employees take a disproportionate amount of sick time and less vacation time. Since this is unique to factory 2, this seems worthy of reporting as a potential cause in the downturn of revenue.
Generate report using Cloudera Data Visualization
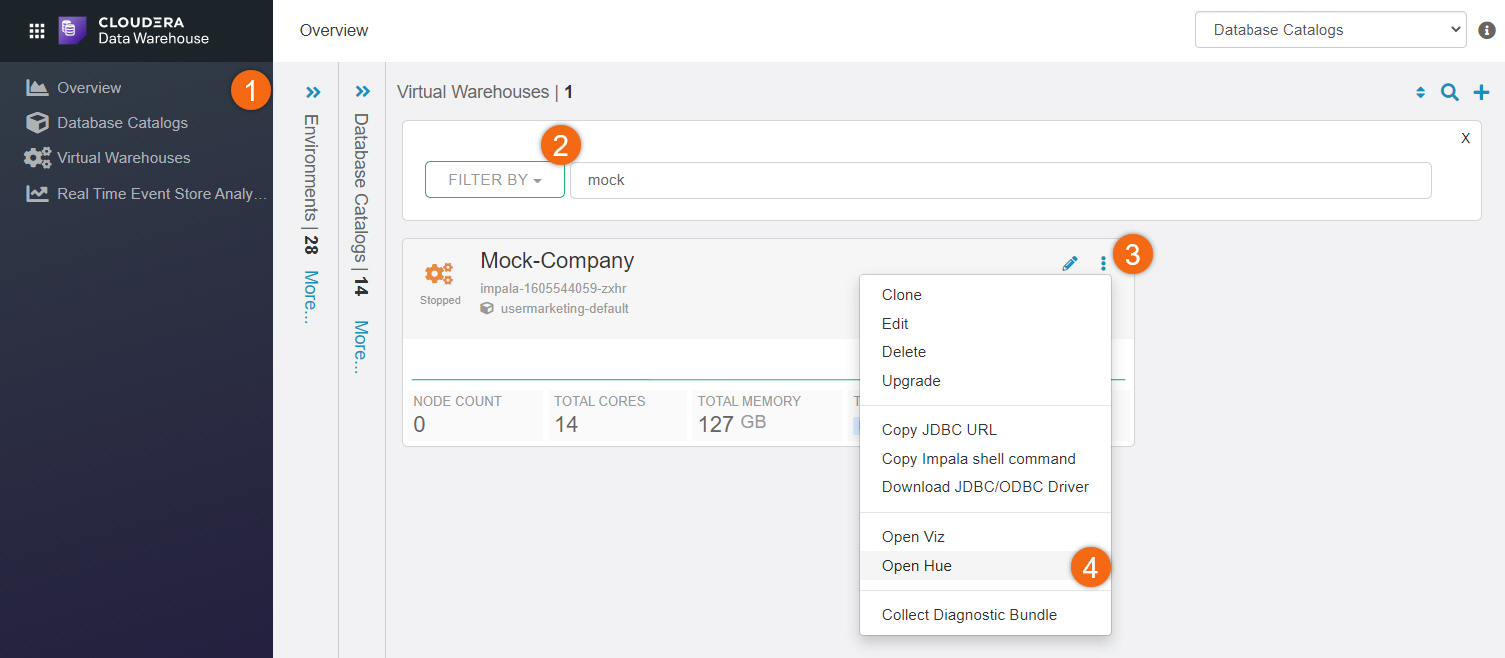
Open Viz
Beginning from Cloudera home page > Data Warehouse:
- Click on Overview
- Search for your Virtual Warehouse
- Click on

- Open Viz
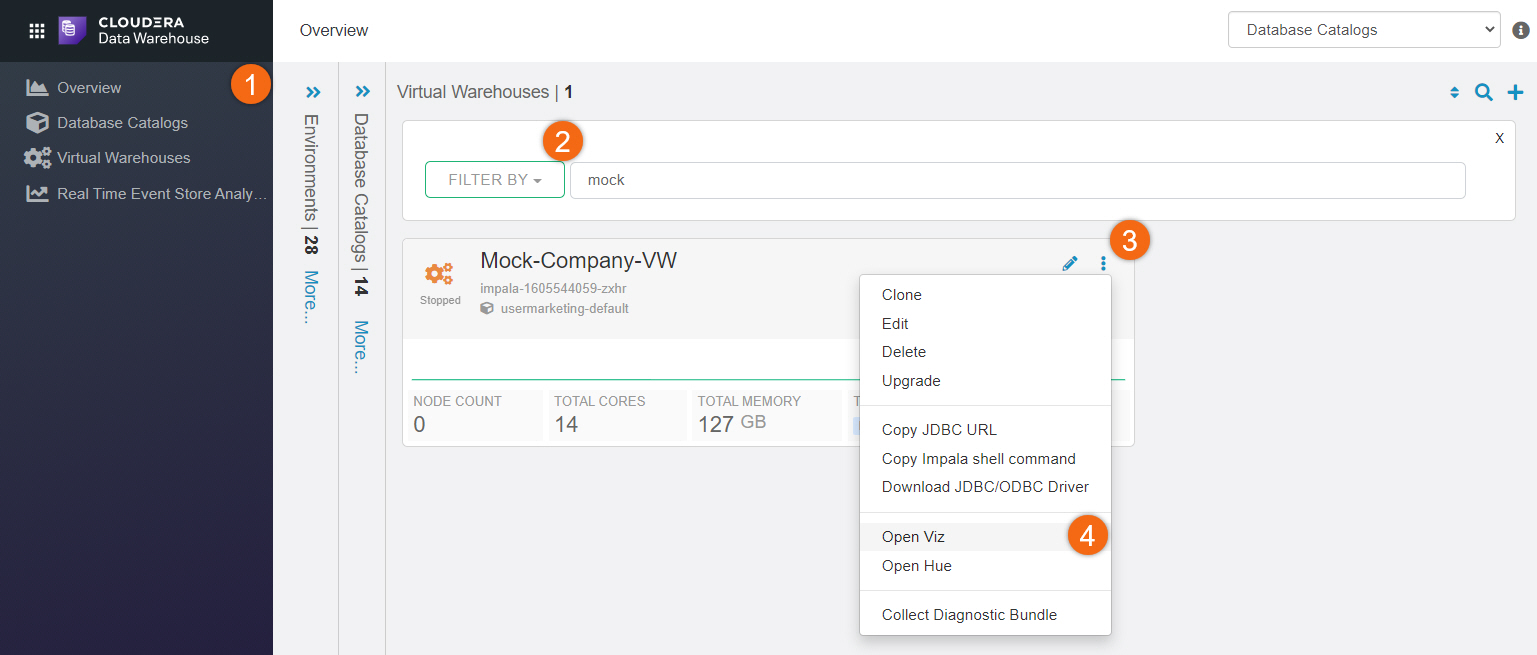
NOTE: You may need to logon using your Cloudera workload userid/password.
Create dataset(s) from data
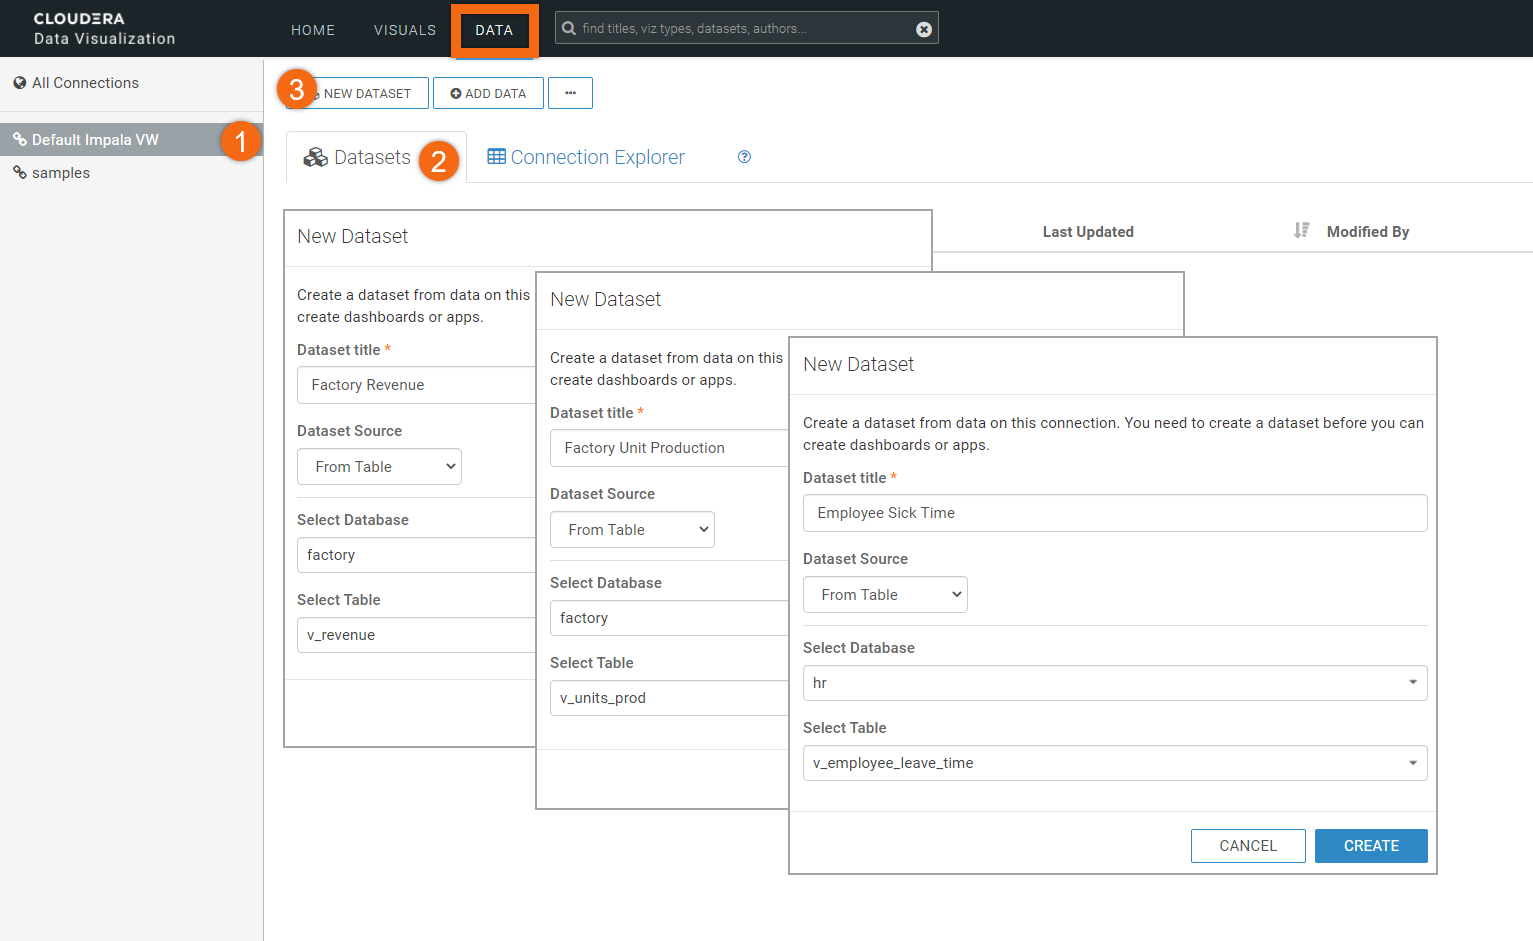
Starting from Cloudera Data Visualization home page, select DATA.
- Select Default Impala VW connection
- Select Datasets tab
- Select NEW DATASET
Create datasets for the following tables:
Dataset Title: Factory Revenue
Dataset Source: From Table
Select Database: factory
Select Table: v_revenue
Dataset Title: Factory Unit Production
Dataset Source: From Table
Select Database: factory
Select Table: v_units_prod
Dataset Title: Employee Sick Time
Dataset Source: From Table
Select Database: hr
Select Table: v_employee_leave_time

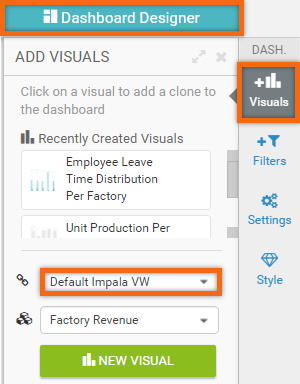
Let’s use Revenue Downturn Investigation for the title of this visual.
In Dashboard Designer, select Visuals tab. We are going to create three (3) new visuals using data connection Default Impala VW.
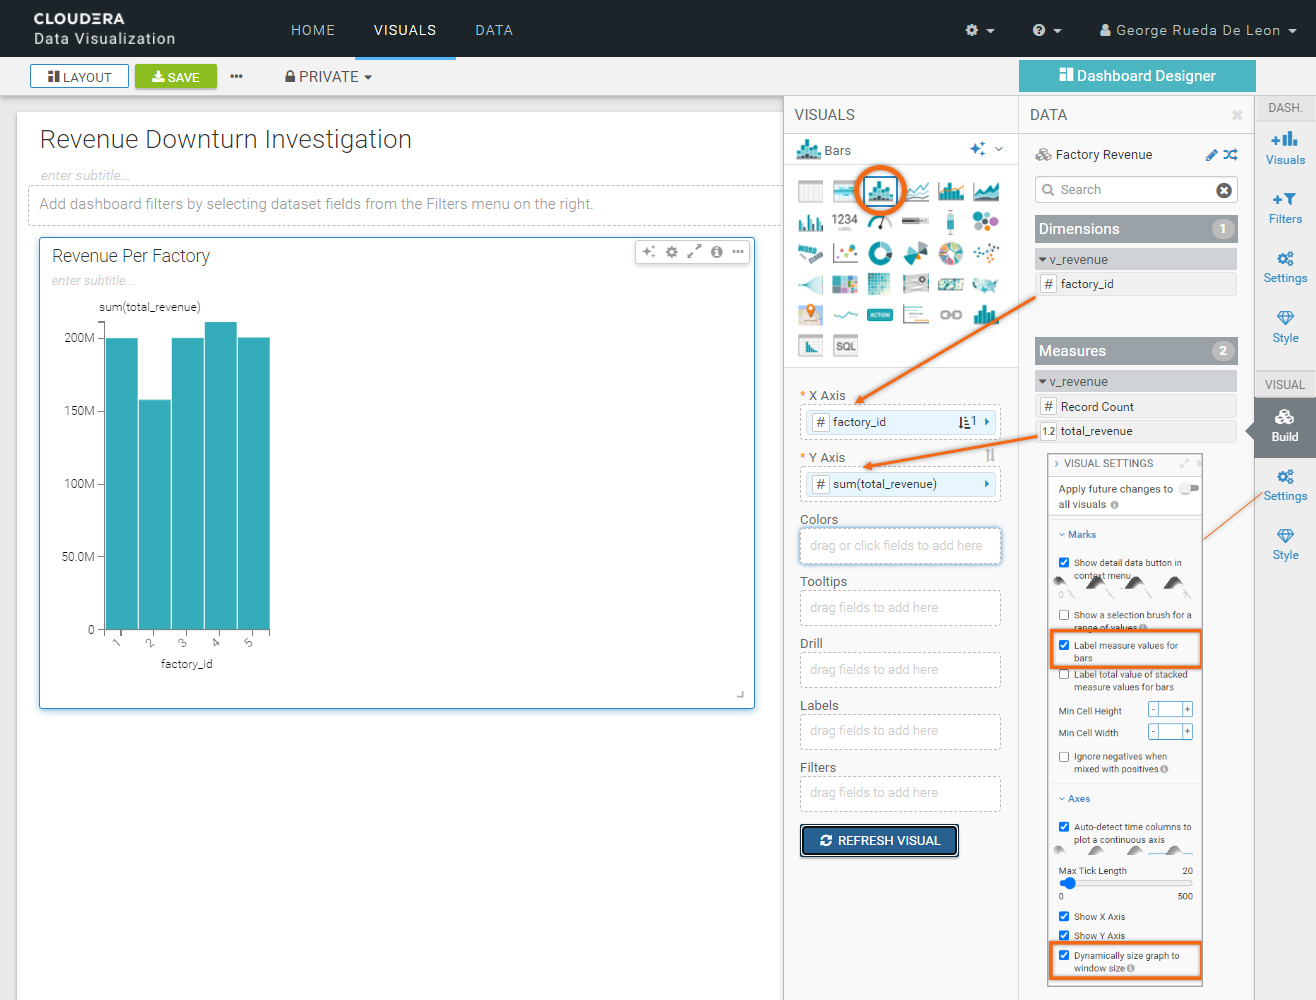
Create visual for table Factory Revenue:
Title: Revenue Per Factory
Build Tab:
Graph Type: Bars
X Axis: factory_id, (ascending order)
Y Axis: total_revenue
Refresh Visual
Settings > Marks > Label measure values for bars: ON
Settings > Axes > Dynamically size graph to window size: ON
Create visual for table Factory Unit Production:
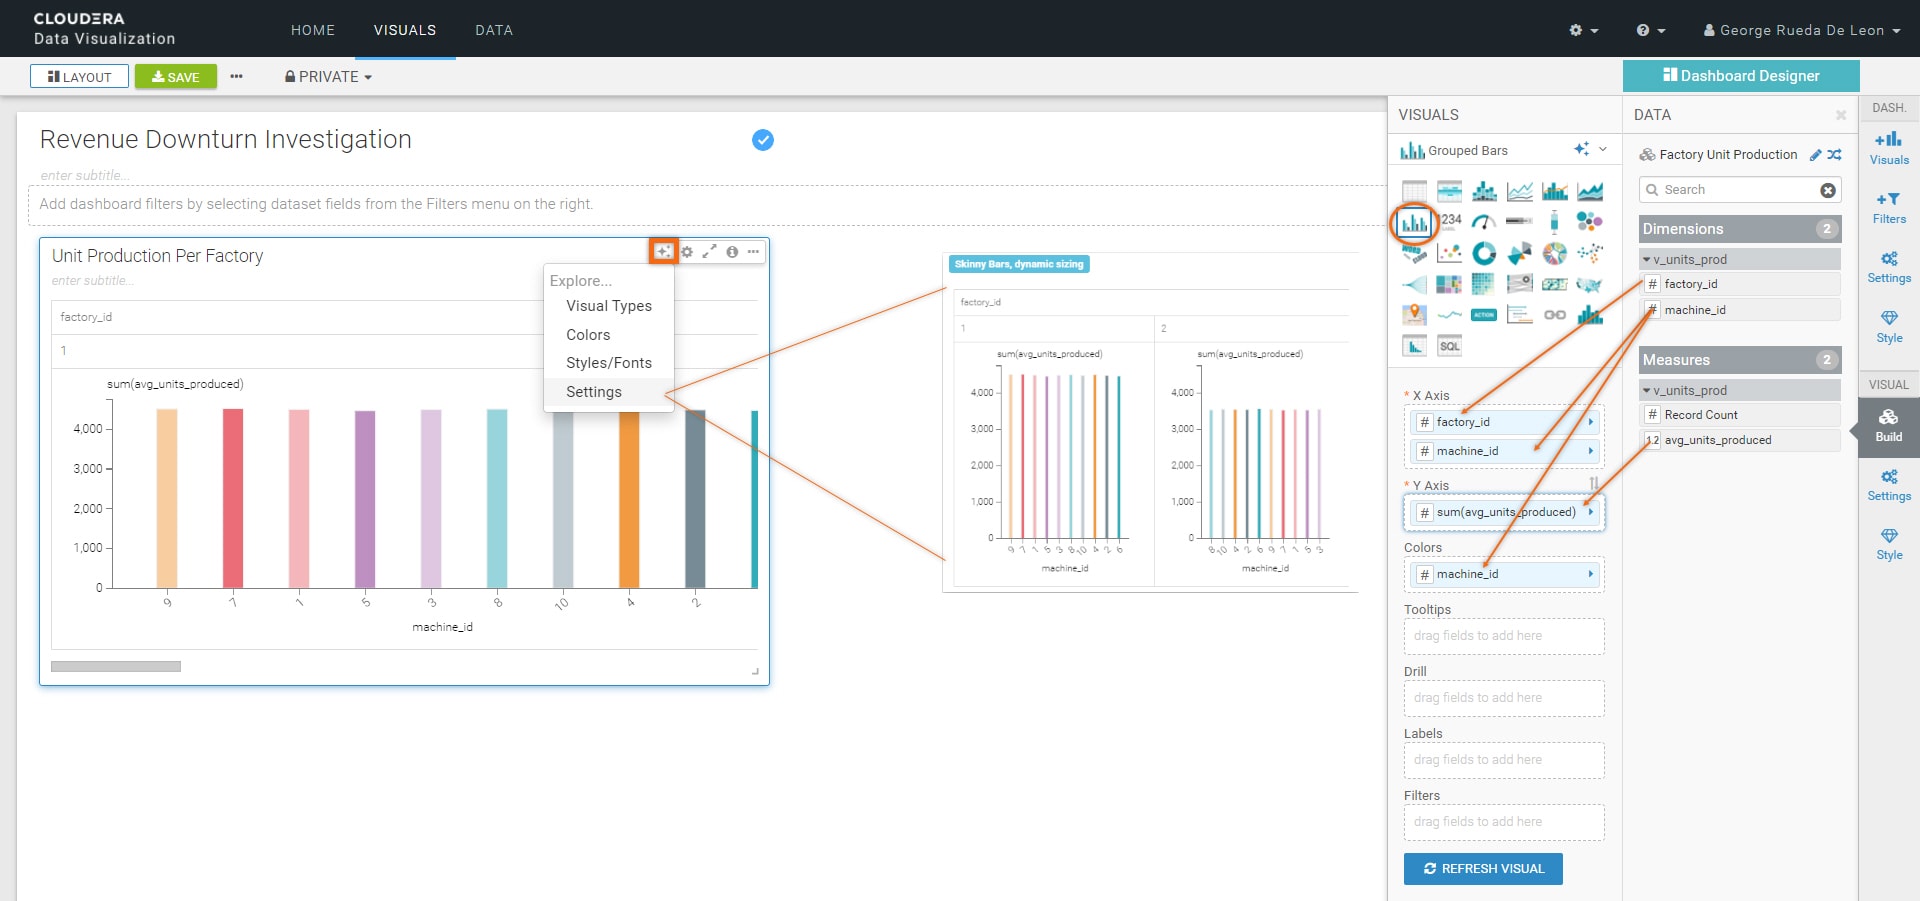
Title: Unit Production Per Factory
Build Tab:
Graph Type: Grouped Bars
X Axis: factory_id, machine_id
Y Axis: avg_units_produced
Colors: machine_id
Refresh Visual
Click Explore Options icon ![]() on the visual and select Settings. Choose Skinny Bars, dynamic sizing.
on the visual and select Settings. Choose Skinny Bars, dynamic sizing.
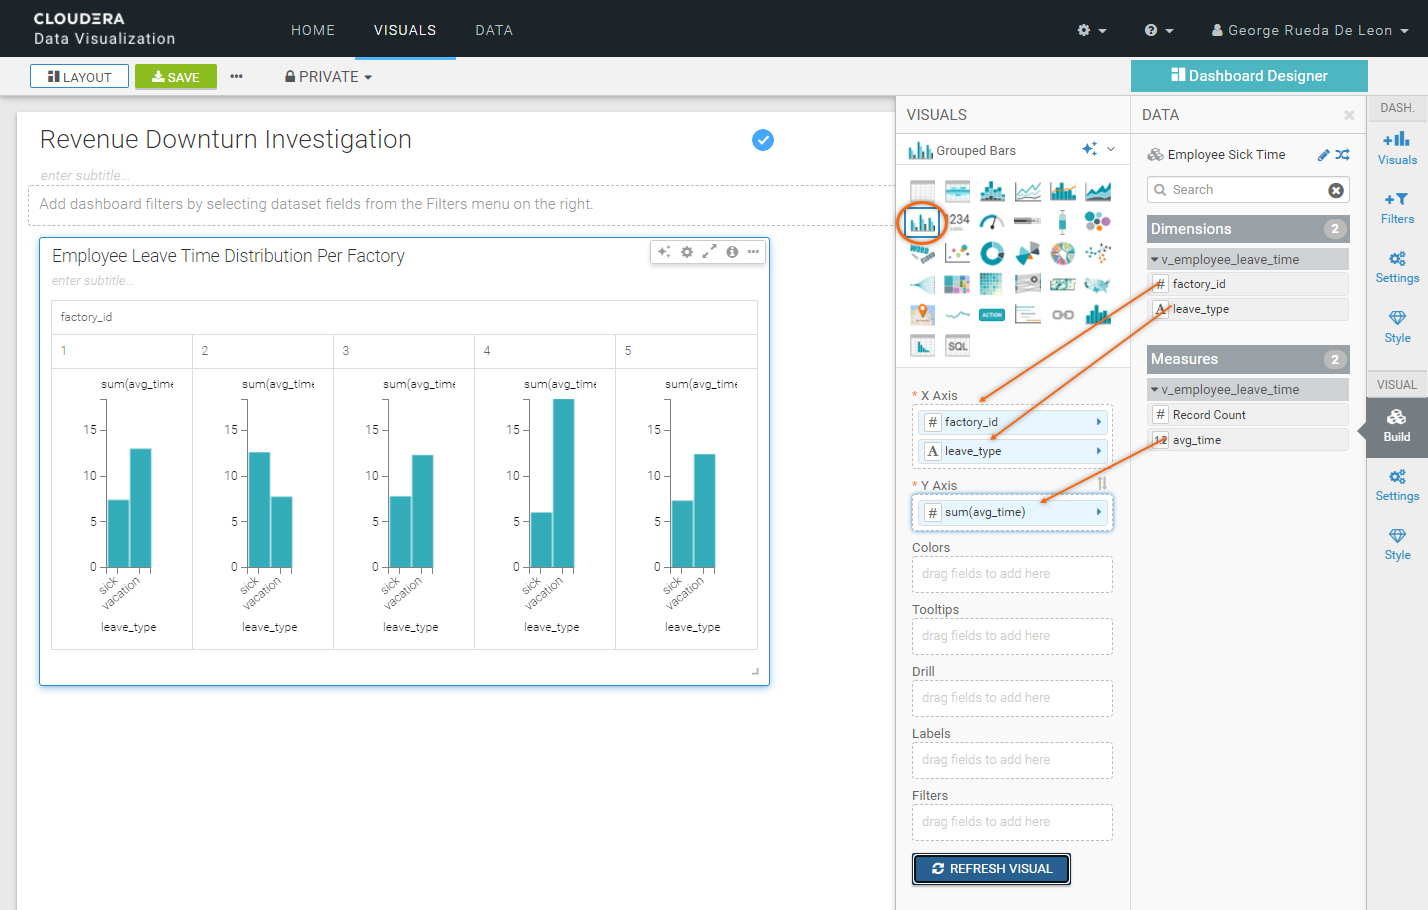
Create visual for table Employee Sick Time:
Title: Employee Leave Time Distribution Per Factory
Build Tab:
Graph Type: Grouped Bars
X Axis: factory_id(ascending order) Leave_type (descending order)
Y Axis: avg_time
Refresh Visual
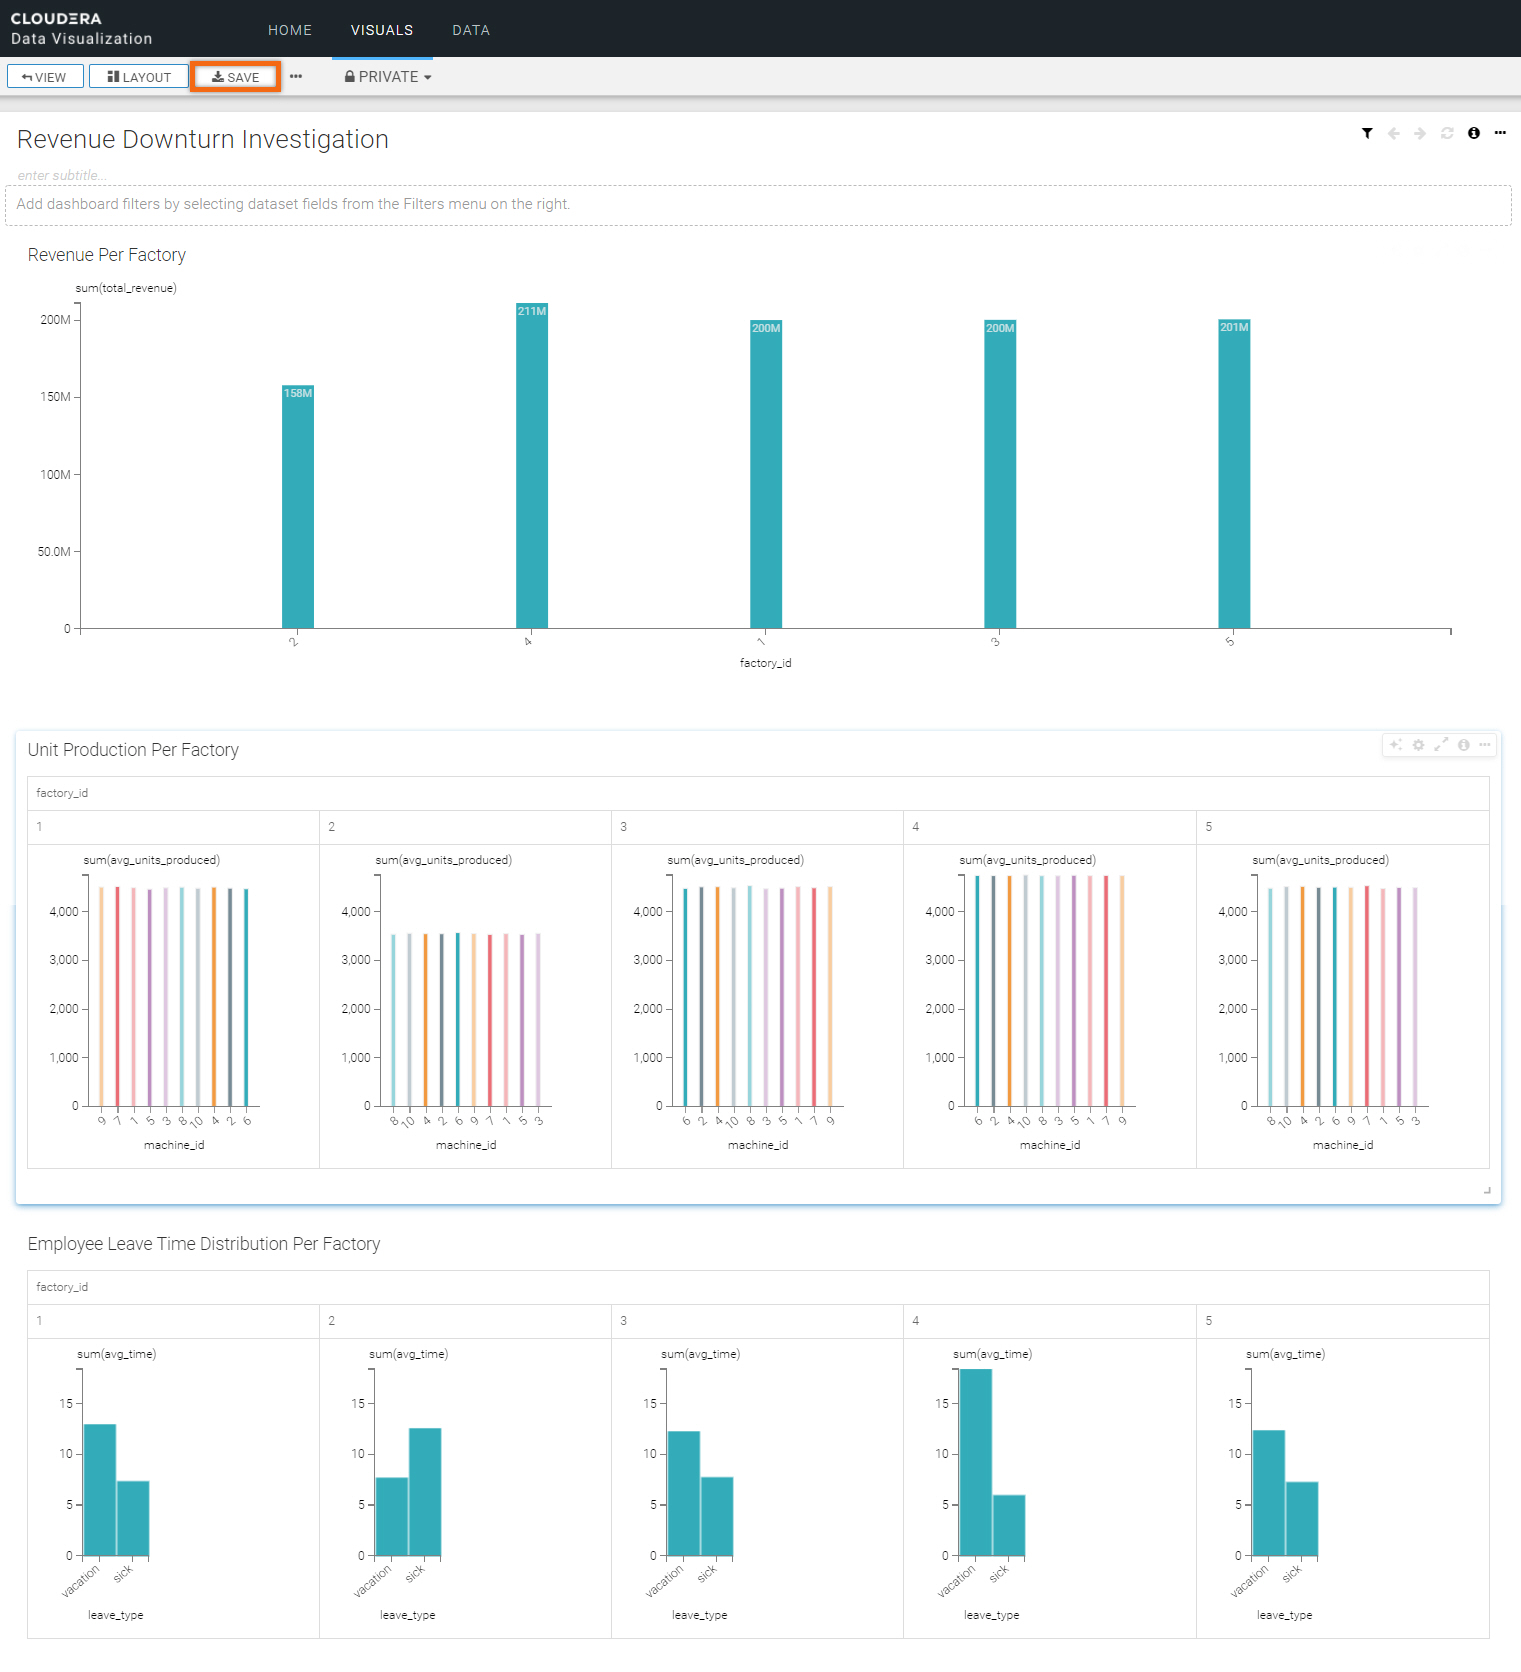
We are done creating our dashboard. To save it, click on Save.
It should look like the following:
Summary
Congratulations on completing the tutorial.
In this tutorial, you got to experiment with several services that Cloudera has to offer:
- Cloudera Data Warehouse (Impala, Cloudera Data Explorer and Data Visualization)
- Cloudera Data Engineering
As you have seen, it was easy to analyze datasets and create beautiful reports using Cloudera Data Visualization.
This tutorial covered a very small portion of what Cloudera Data Warehouse, Cloudera Data Engineering and other Cloudera experiences can do. You are encouraged to continue exploring and broaden your knowledge.
Further reading
Other
- Have a question? Join Cloudera Community
- Cloudera Data Warehouse documentation
- Cloudera Data Engineering documentation


