
Time Series as Fast Analytics on Fast Data
Since the open-source introduction of Apache Kudu in 2015, it has billed itself as storage for fast analytics on fast data. This general mission encompasses many different workloads, but one of the fastest-growing use cases is that of time-series analytics. Time series has several key requirements:
- High-performance streaming ingest – time-series workloads increasingly need to ingest data from thousands or millions of data sources at high sampling rates. The storage system needs to support inserting millions of records per second without expensive hardware investment.
- Immediate availability of data after ingestion – sometimes the most valuable time-series data is the data that was ingested in the last few seconds. Waiting for batch pipelines to ingest data into storage systems for static data (e.g. cloud blob storage) is not an option.
- High-performance scans – having ingested millions or billions of data points, it’s often necessary to analyze them in aggregate. For example, rollups and aggregations may be calculated across time or across entities, and machine learning models may be built to look for anomalies or predict future behavior. Time-series storage needs to support the retrieval of billions of cells per second on inexpensive hardware configurations. In some cases, pre-aggregation and downsampling can reduce this requirement, but in many others, access to granular data is required.
- High-performance low latency random lookups – in addition to scanning large amounts of data, online operational use cases such as dashboarding or real-time monitoring need to be able to fetch short runs of data at very low latency and high throughput. For example, fetching one hour of data for a given entity may have a 95th percentile latency SLA of 10ms.
At first glance, it sounds like these requirements would demand a special-purpose database system built specifically for time series. Indeed, systems such as InfluxDB and VictoriaMetrics have sprung up in recent years to tackle this niche. Is it possible that a general-purpose system like Kudu can compete with these targeted designs?
In this blog post, we’ll evaluate Kudu against three other storage systems using the Time Series Benchmark Suite (TSBS), an open-source collection of data and query generation tools representing an IT operations time-series workload
Kudu-TSDB Architecture
Since Kudu is a storage system without any built-in query language, I developed a prototype of a new daemon called kudu-tsdbd. This daemon serves an HTTP endpoint that is compatible with InfluxDB’s REST protocol, and includes a parser and executor for a subset of the InfluxQL query language. As such, the TSBS support for benchmarking InfluxDB can be reused to benchmark the Kudu-based implementation.

Note that this architecture adds an extra “hop”. Every query is submitted to the time series daemon, parsed and planned, and then converted to one or more “scan” calls into tables stored in the underlying Kudu cluster. All of the underlying data is then transferred back from Kudu into the TSDB process for aggregation and processing. Nevertheless, as shown below, Kudu offers competitive and often superior performance compared to monolithic time series systems.
Benchmarking target systems
This blog post evaluates the TSBS benchmark against four target systems:
- InfluxDB 1.7.10 – InfluxDB is an open-source time-series database developed by InfluxData, written in Go. The open-source version only supports single-node operation, but a clustered version is available as a paid offering.
- VictoriaMetrics 1.34.2 – VictoriaMetrics is an open-source Time Series Database and long-term remote storage for Prometheus. Both single-node and clustered offerings are available.
- ClickHouse 20.1.6.30 – ClickHouse is an open-source columnar SQL database. Like Kudu, it is a general data store and not limited to time series data.
- Kudu-tsdbd – The above time series daemon, posing as InfluxDB, running on top of a single-node Kudu cluster on the same host. The version of Kudu tested includes some optimizations that will be incorporated into Apache Kudu over the coming months as described at the bottom of this article.
Benchmark hardware
Following the example of this ClickHouse TSBS Benchmark we use a single EC2 r5.2xlarge node with the following specifications:
- 8 vCPUs
- 64G RAM
- 200GB of Provisioned IOPS EBS (note: the dataset in this benchmark is small enough that disk performance does not appear to be a significant factor)
- Ubuntu 18.04.1 LTS
The price for this hardware is approximately $12/day.
The TSBS client, as well as the target system, are run on the same host, eliminating network transfer of the result data as a bottleneck.
Benchmark setup
Following the same benchmark setup as used in earlier blog posts by VictoriaMetrics and ClickHouse, we use the following configuration:
- TSBS cpu-only Workload – This workload is derived from InfluxData’s own influx-comparisons benchmark tool, used in comparisons such as Influx vs Cassandra, Influx vs OpenTSDB, etc. This workload is chosen due to it being well supported across a large number of time series databases.
- Scale Factor 4000, 3 days – simulates 4000 hosts generating 10 CPU metrics once every 10 seconds. This results in a total of approximately 1 billion data points in the dataset.
We run all of the supported queries except as noted below:
- lastpoint, groupby-orderby-limit – not supported by kudu-tsdbd nor by VictoriaMetrics. Supported with very low performance by ClickHouse and Influx. These queries are difficult to support efficiently because they require a reverse-ordered scan feature not implemented in many storage engines.
- high-cpu-* – not supported by VictoriaMetrics, partially supported by kudu-tsdbd. Kudu-TSDB lack of support is due to a small deficiency in the InfluxQL execution engine rather than any missing underlying storage engine capability.
The queries are classified into two groups:
- Light queries – these respond in ~200ms or less on all systems, and we measure both throughput (QPS) as well as 95th and 99th percentile latencies as a measure of consistent performance.
- Heavy queries – these can take several seconds and aggregate large amounts of data and we measure throughput in queries per minute (QPM)
The workloads are run both with 8 client threads (equal to the number of CPUs) and with 16. The latter configuration tests the systems’ robustness when faced with overload scenarios. In this first post, we’ll focus on the “light” queries. In a follow-on post, we’ll analyze the performance of the “heavy” queries.
All benchmark results can be reproduced using scripts available on github.
Results: Data Loading Performance
One of the requirements noted in the introduction to this post is high-performance loading. Here we graph the number of metrics per second during the data load for each system:
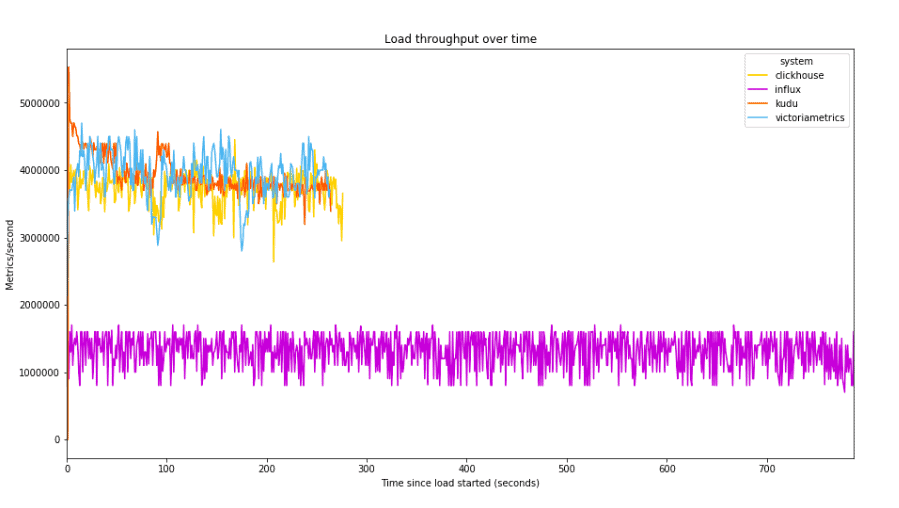
Here we see that Kudu, ClickHouse, and VictoriaMetrics are all roughly comparable, with average rate between 3.7M and 3.9M metrics/second. InfluxDB lags significantly behind, averaging 1.3M metrics/second, and thus taking approximately 3x as long to load the test dataset. The load times here closely mirror those in ClickHouse team’s benchmark report.
Results: Light Queries, 8 client threads
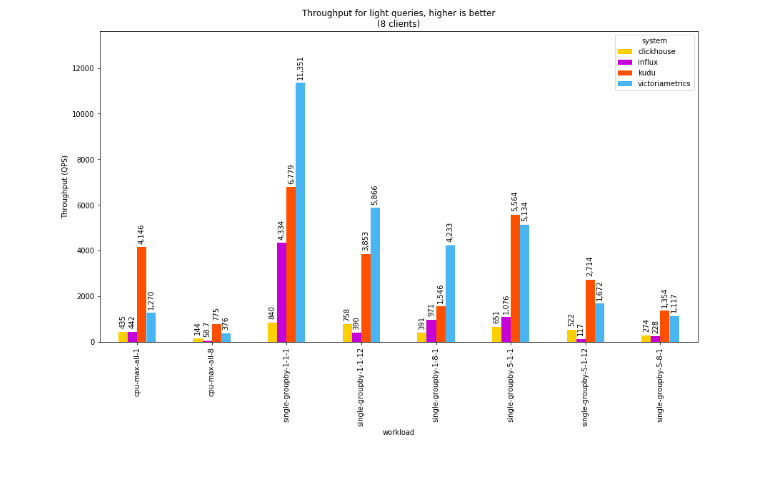
In terms of throughput for short-running queries, VictoriaMetrics makes an impressive showing, particularly on the simplest query (single-groupby-1-1-1) which just fetches a single metric for a single hour from a single host (360 points). On other queries, Kudu edges it out, in some cases by a significant factor. In every query type, Kudu outperforms ClickHouse, and is 5-10x faster than InfluxDB.
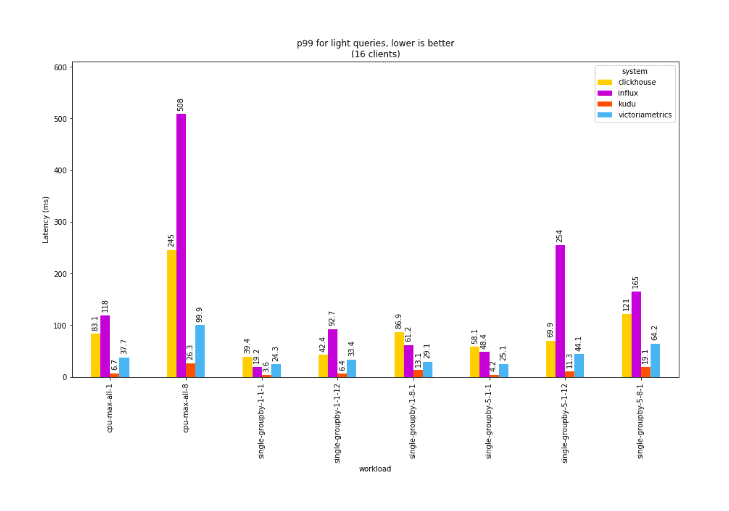
For light queries, it’s also interesting to look at percentiles: a single dashboard may run hundreds or thousands of these short queries before being able to fully render, so the rendering time is dominated by these high-percentile outliers.
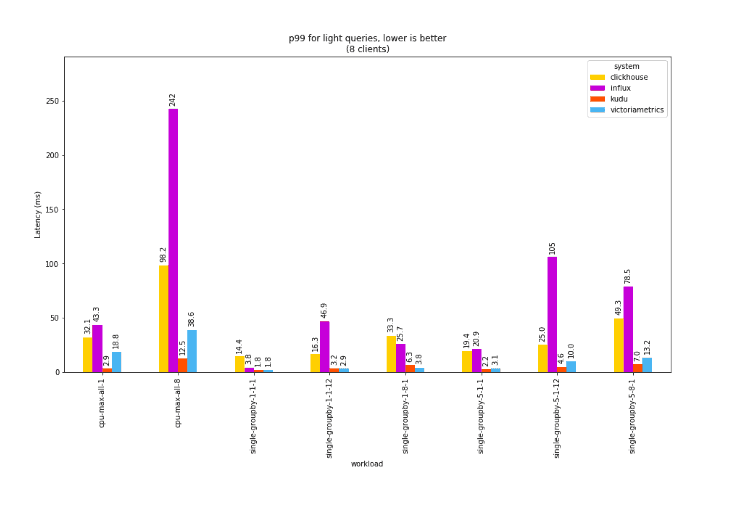
In this chart of 99th percentile latencies, where shorter bars indicate faster response times, we see that Kudu and VictoriaMetrics again outperform the competition by an order of magnitude, with Kudu coming out on top in most cases, sometimes by a substantial margin.
Results: Light Queries, 16 client threads
When evaluating a system, it’s also useful to look at how the system performance degrades under load. If we double the number of clients, so that instead of having one client per core, we now have two, we don’t expect the throughput to double, but we also would hope to avoid any substantial degradation.InfluxDB is 5-10x slower in every case.
For light queries, it’s also interesting to look at percentiles: a single dashboard may run hundreds or thousands of these short queries before being able to fully render, so the rendering time is dominated by these high-percentile outliers. The following chart shows the throughput for light queries in such a scenario:
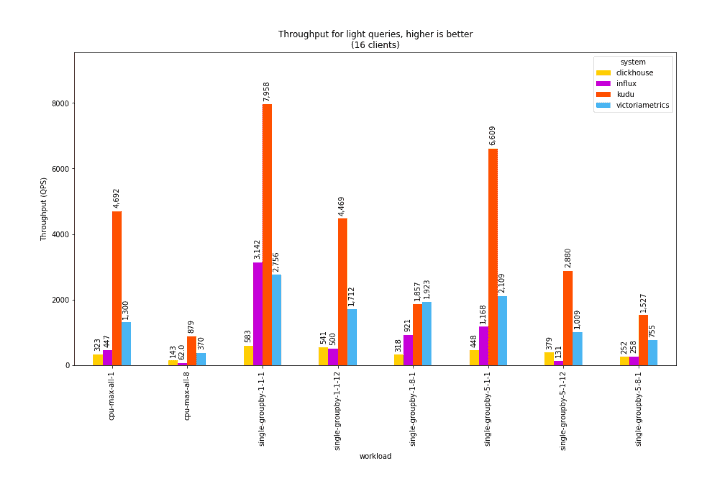
Here, Kudu shows slight improvements in throughput between 8 and 16 clients. This is due to various amortization and batching effects within Kudu as well as underutilization at the 8-client level. In contrast, VictoriaMetrics exhibits a substantial drop in throughput when under overload. ClickHouse also shows slight reduction in throughput in this scenario.
In terms of latency, we see the same effect: Kudu’s p99 latencies remain low whereas other systems show substantial degradation while under overload:
Performance on heavy queries
The “heavy” queries in the benchmark scan through all of the data in the dataset for a single day, computing time-windowed aggregates of either 1, 5, or all 10 columns. This results in a scan of over 30M, 150M, or 300M cells to compute the query results. These queries show the relative performance for large scans and may also correlate with the performance of data export into other workloads such as machine learning or anomaly detection.
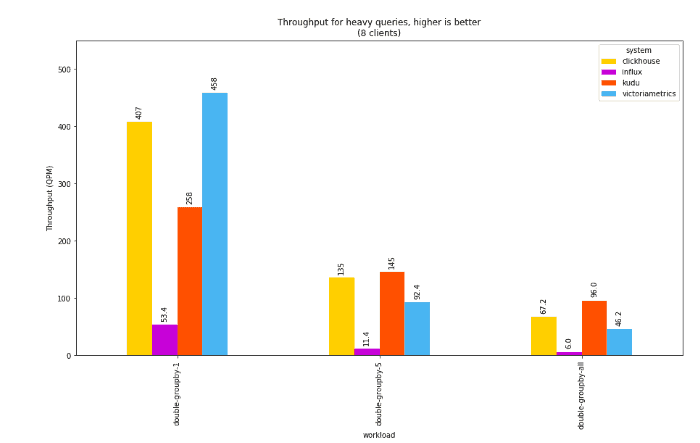
For these queries, we see mixed results, except for the one constant that InfluxDB is orders of magnitude slower than the rest of the pack. As the size of the scan increases from 1 to 10 columns, Kudu edges ahead of the others.
Note: Given the architecture of Kudu and Kudu-TSDB, these queries spend most of their CPU cycles in the kernel transferring data from the Kudu tablet server process into the time series daemon. Future efforts to optimize this (e.g. by allowing some limited pushdown of computation into the Kudu process itself) would substantially improve Kudu here.
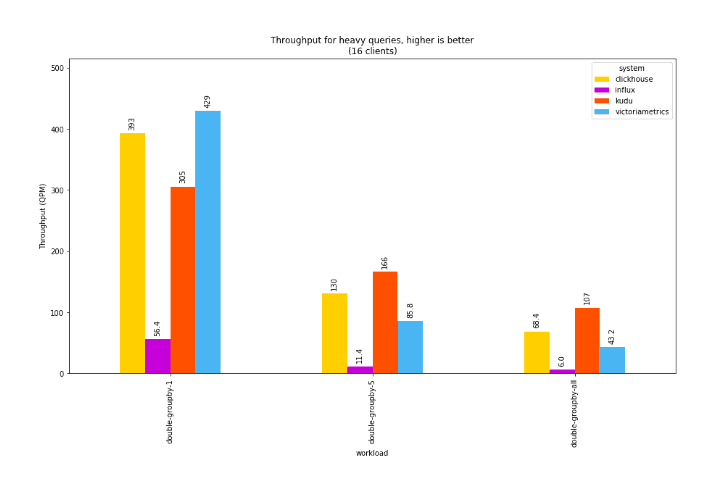
For these heavier queries, we no longer see a substantial throughput collapse on VictoriaMetrics, but we again note the 10-20% improvement in throughput for Kudu.
Benchmark Summary:
Although Apache Kudu is a general purpose store, its focus on fast analytics for fast data make it a great fit for time series workloads. Summarizing the benchmark results:
- Kudu is on par with ClickHouse and VictoriaMetrics for data loading performance. All three outperform InfluxDB by a substantial margin.
- Kudu and VictoriaMetrics outperform ClickHouse and InfluxDB for throughput (QPS) of short running queries. In some cases, Kudu has higher throughput that VictoriaMetrics, and in other cases, VictoriaMetrics outperforms Kudu.
- For long running queries, Kudu provides superior performance to other stores as the number of measurement columns increases, and is not substantially outperformed in any query type.
- Kudu outperforms all other systems when the number of client threads is increased to double the number of cores, showing stable performance both in terms of throughput and high-percentile latencies.
Qualitative Differences
In addition to the quantitative differences summarized above, it’s important to understand qualitative differences between the stores. In particular, Kudu and ClickHouse share the trait of being general-purpose stores, whereas VictoriaMetrics and InfluxQL are limited to time series applications. In practical terms, this means that Kudu and ClickHouse allow your time series data to be analyzed alongside other relational data in your warehouse, and to be analyzed using alternative tools such as Apache Spark, Apache Impala, Apache Flink, or Python Pandas.
In addition, Apache Kudu has a wide enterprise-grade feature set including:
- Scalability to hundreds of nodes, with automatic fault recovery, failure domain awareness and rebalancing
- Security controls including authentication, encryption on the wire, and authorization
- Support for backup and restore using Apache Parquet on blob stores or HDFS
Apache Kudu’s background as a store for high-value data warehouse and datamart use cases also means it has clear and strong semantics. Inserted data is immediately visible, visible data is durable, and operations such as deletion and updates of data are fully supported. Other systems benchmarked here have certain surprises. For example:
- VictoriaMetrics does not make data available for read until 30 seconds after ingest. Additionally, it has no Write-Ahead Log so a crashed server will lose recently inserted data. Replication is only available by using persistent disks (e.g. EBS) which have annual failure rates of 0.1-0.2%.
- InfluxDB’s update and delete capability is limited. For example, replacing a value with a NULL entry is not supported and predicate-based updates and deletes are not supported.
Upcoming Improvements to Apache Kudu
In preparation for this blog post, many improvements were identified and made to Apache Kudu itself. The following new features were implemented in a fork of Kudu and reflected in the benchmarks above:
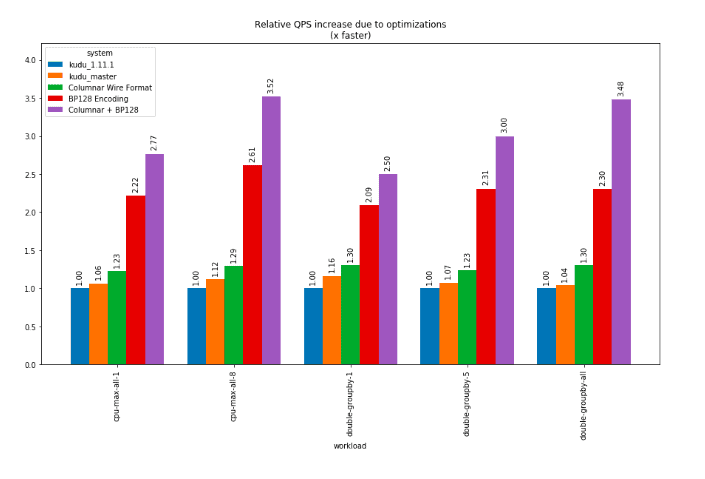
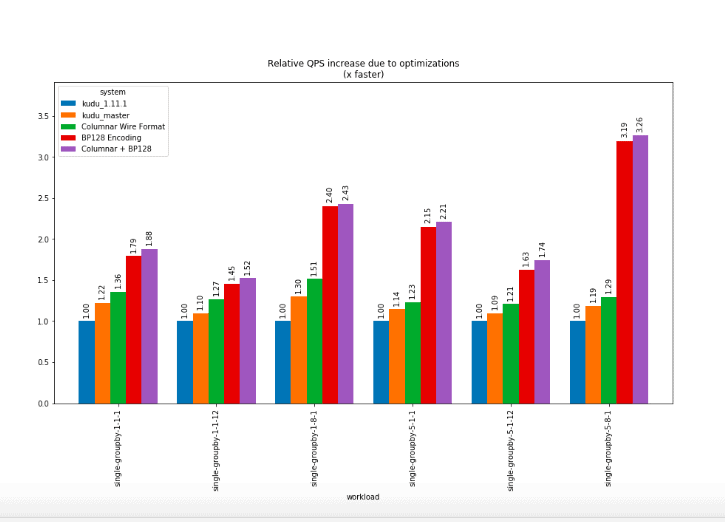
- Columnar data transfer – a columnar data transfer format allows the Kudu tablet server to return scanned row results with substantially lower CPU consumption compared to the current row-oriented result format. On its own this yielded a geometric mean improvement of 1.13x across our supported queries.
- SIMD-BP128 Encoding – a new encoding was developed for integer data allowing higher scan speeds and better compression. This encoding needs further development to be robust to all cases but should eventually replace the bitshuffle encoding used by Kudu today as the default integer encoding. On its own this yielded a geometric mean improvement of 1.88x across our supported queries.
- When combining the columnar data transfer and the BP128 encoding, the mean improvement was 2.17x.
These improvements come on top of other performance improvements already committed to Apache Kudu’s master branch (as of commit 1cb4a0ae3e) which represent a 1.13x geometric mean improvement over Kudu 1.11.1. Including all optimizations, relative to Apache Kudu 1.11.1, the geometric mean performance increase was approximately 2.5x.
The following graphs illustrate the performance impact of these changes. Each bar represents the improvement in QPS when testing using 8 client threads, normalized to the performance of Kudu 1.11.1.
We expect to begin incorporating the BP128 and columnar encoding improvements into Apache Kudu over the coming months.
The future of kudu-tsdbd
In terms of the kudu-tsdbd daemon that presents an InfluxQL compatibility layer, this is currently just a prototype and not available for general consumption. Although it performs favorably compared to InfluxDB and other systems, it is currently missing many features such as a wide variety of aggregation functions, support for more complex queries such as subqueries, etc. Depending on community interest, we may continue to develop this from a prototype into a fully functional query layer. If you are interested in using or helping with the development of such a layer, please contact the Kudu community.