Introduction
In this tutorial you will learn about clustering techniques by using Cloudera AI; an experience on Cloudera Platform. Clustering is an unsupervised machine learning algorithm that performs the task of dividing the data into similar groups and helps to segregate groups with the similar data points into clusters.
In this tutorial we’ll cover K-means clustering technique. We’ll build the model, deploy, monitor and create jobs for the model to demonstrate the working of clustering techniques on Mall Customer Segmentation Data from Kaggle.
Prerequisites
To better understand this tutorial, you should have a basic knowledge of statistics, linear algebra and the python scikit-learn library
Outline
K-means clustering overview
Clustering is an unsupervised machine learning algorithm that performs the task of dividing the data into similar groups and helps to segregate groups with the similar data points into clusters. For example, often companies use the clustering strategy to find interesting patterns of customers to enhance their business. Consider a retail store that wants to increase their sales. Can the company look into each of the customer details to devise their business strategy? That is not easy. The company can, however, divide the customers into different clusters according to their purchasing habits and then apply a strategy for each group.
In this tutorial we will explore a centroid based clustering method known as K-means clustering model.
Centroid based clustering
These types of clustering models calculate the similarity between two data points based on the closeness between a data point and cluster centroid. These models run iteratively to find a local optimum value given a number of clusters (passed in as an external parameter). K-Means clustering falls under this category.
K-Means clustering algorithm
Given a number of clusters k, the K-means algorithm can be executed as follows:
Partition data points into k non-empty subsets
Identify cluster centroids (mean points) of the current partition
Assign each point to a specific cluster
Compute distances from each point and allot points to the cluster where the distance from the centroid is minimum
After re-allocating the points, find the centroid of the new cluster formed
Creation of models and jobs using Cloudera AI
This section describes an example of how to create a model and create jobs to run using Cloudera AI.
For the purpose of this tutorial we are going to create a model that will demonstrate K-Means clustering concepts using scikit-learn. To run this project, you have to have your environment ready. Follow the steps below to set up your environment and then run the model.
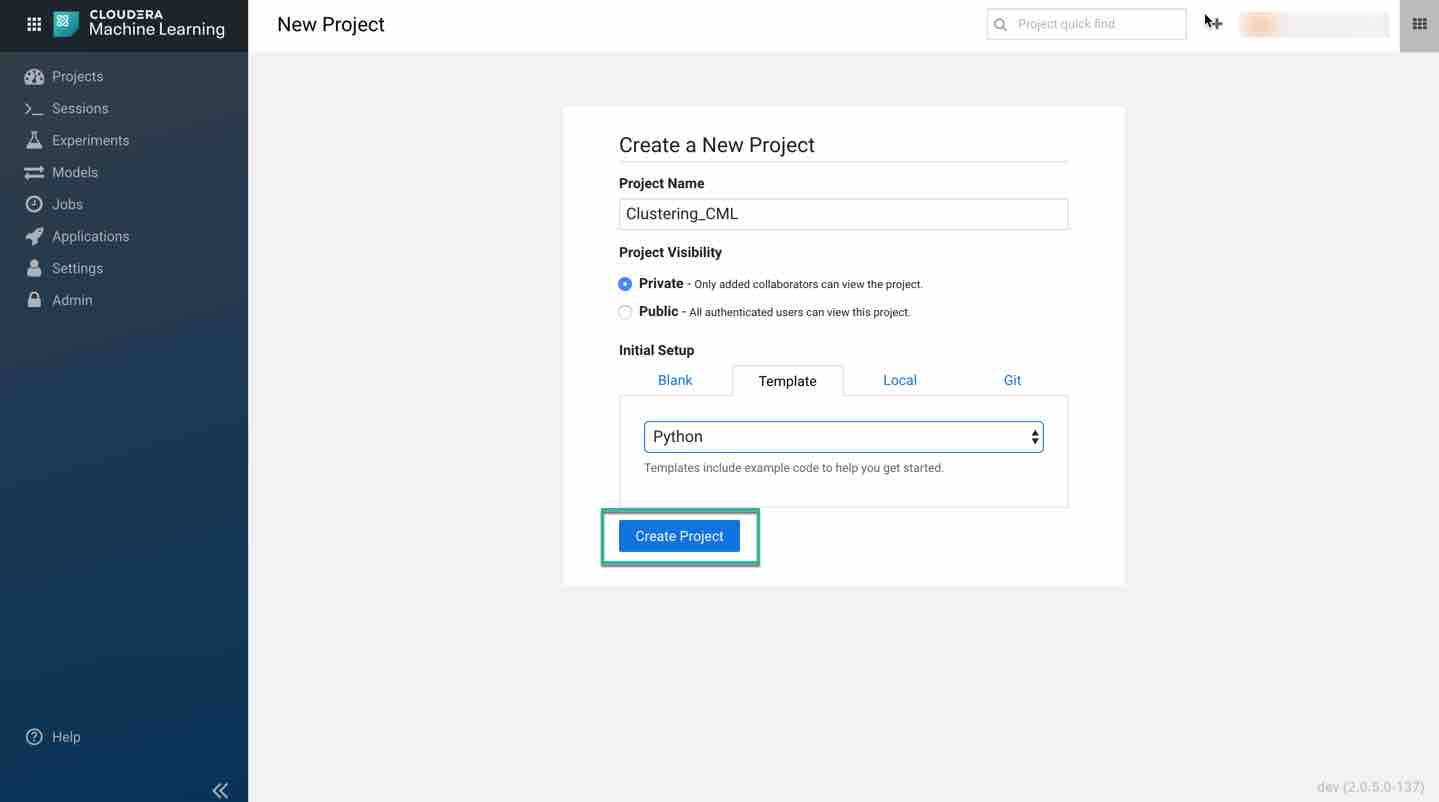
Create a new project. Note that models are always created within the context of a project. Name your project and pick python as your template to run the code.
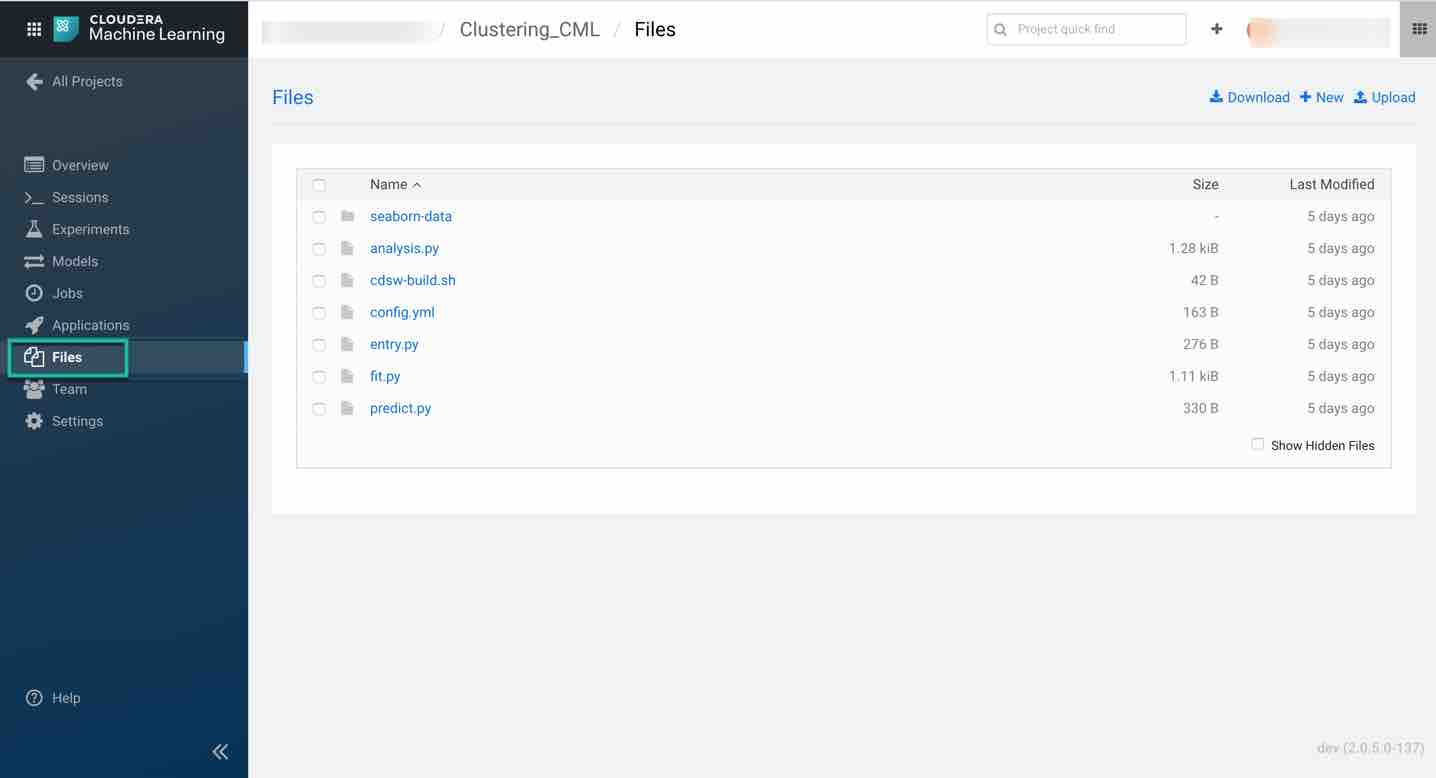
Next, download the code snippet and unzip it on your local machine. Upload K-means.py file using the Files tab in the project overview page. Also upload the dataset called Mall_Customers.csv.
Dataset Overview: Mall_Customers.csv dataset is obtained from Kaggle which consists of the below attributes. In this tutorial we are trying to perform customer segmentation using this dataset.
- Customer ID
- Genre
- Age
- Annual Income
- Spending Score (1-100)
Once the file is uploaded successfully, provision your workspace by clicking on Open Workbench on the top right of the overview page. Choose the desired system specifications. For this tutorial we are using the following specifications:
- Editor: Workbench (You can also choose Jupyter Notebook to run the code)
- Engine Kernel: Python3
- Engine Profile: 1 CPU/ 2 GB Memory
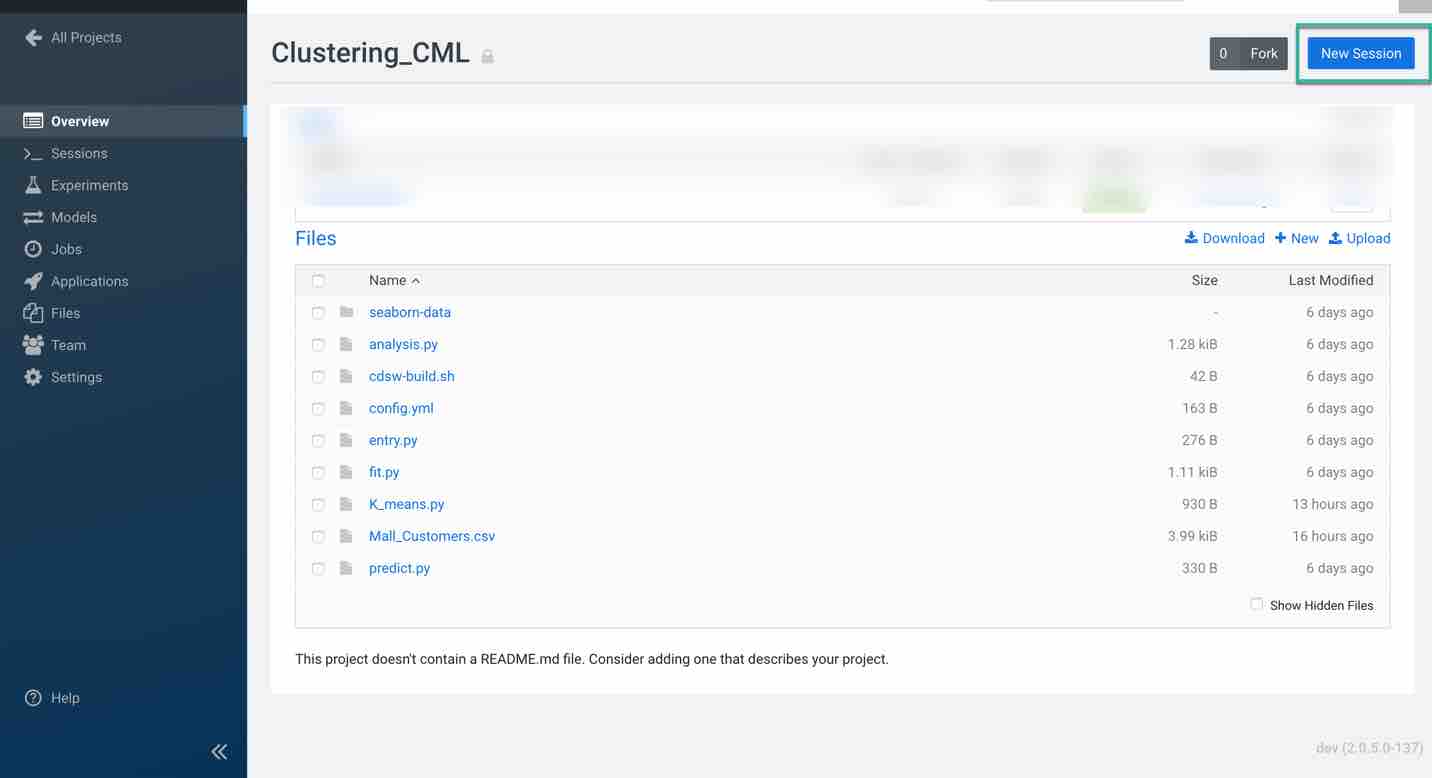
Click on New Session, select K_means.py on the left pane, code on the workspace now looks like below and is ready for execution.
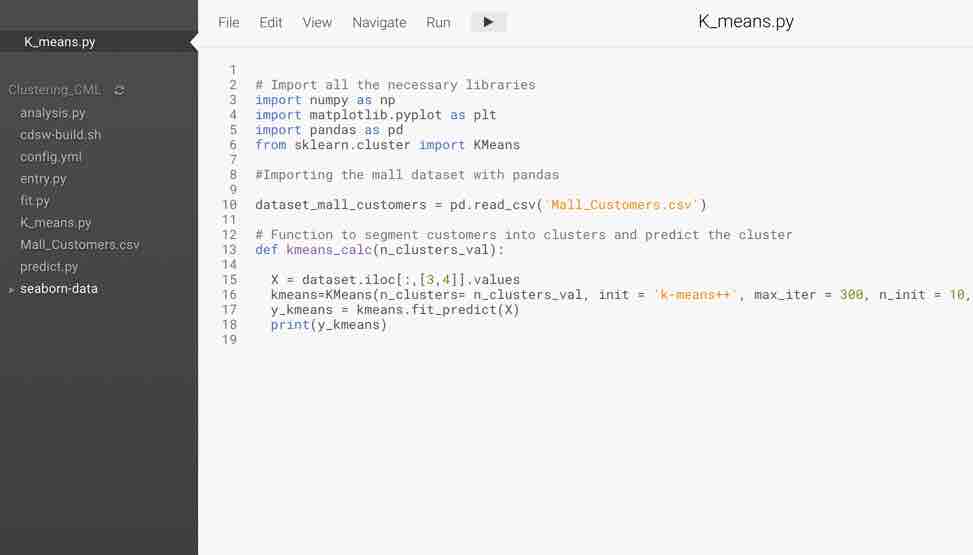
The main purpose of this code snippet is to segment the customers in the dataset into different groups based on the available features. Two important features we take into consideration is the customer Annual Income and the Spending score. We define function names k_means_calc with n_clusters_val as an argument which is the number of clusters in which the customers are divided into. Using this code snippet we will conduct experiments to observe results for different n_clusters_val values.
Next, run the code snippet.
Note: Make sure you have sklearn installed on the workspace to avoid errors in execution. Use the command line on the right side of the workspace as shown below and install sklearn.

Run the code snippet, your output should look like below.
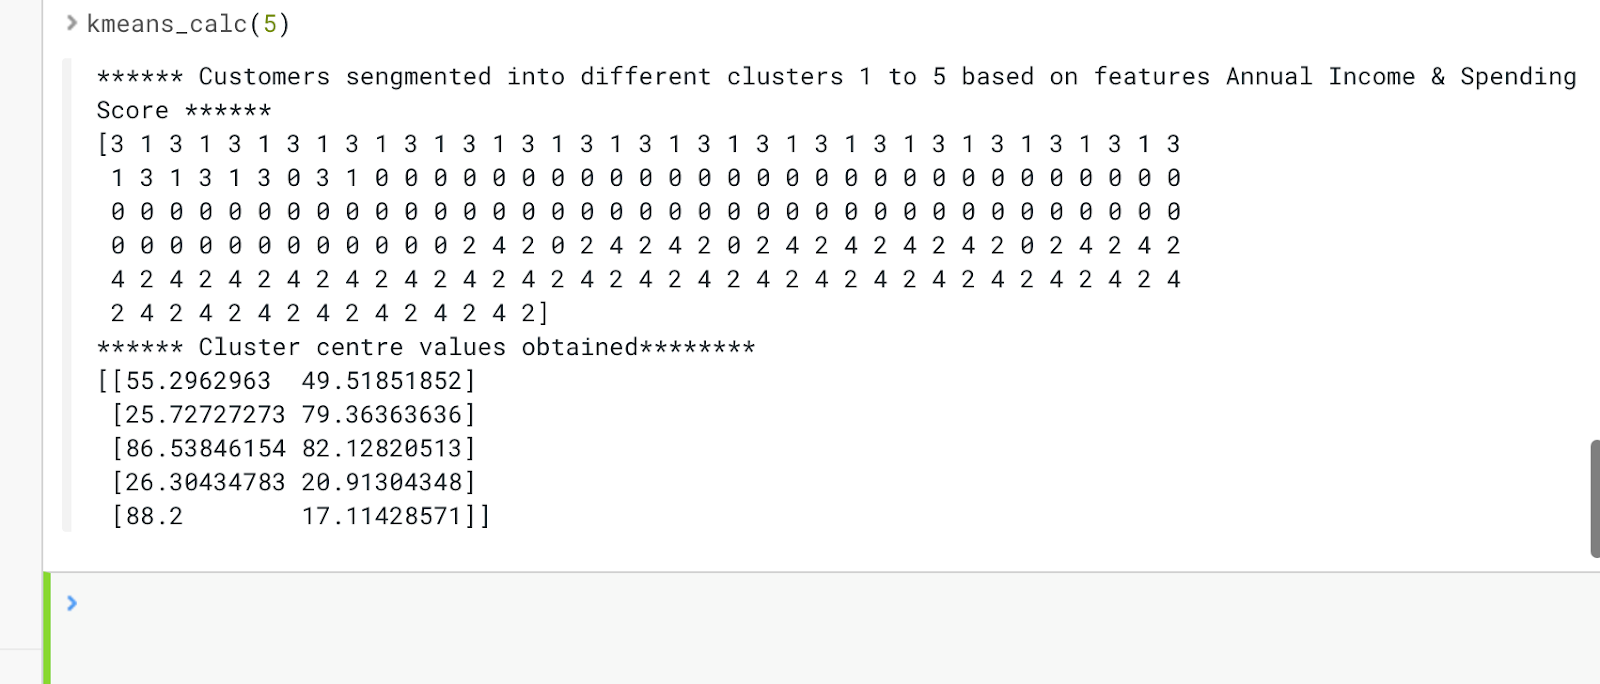
The output of the code represents the cluster number which a customer could fall into based on their income and spending score. Also, we are printing the center values obtained for each cluster.
Let’s now use this code snippet to perform experiments.
Running model experiments using Cloudera AI
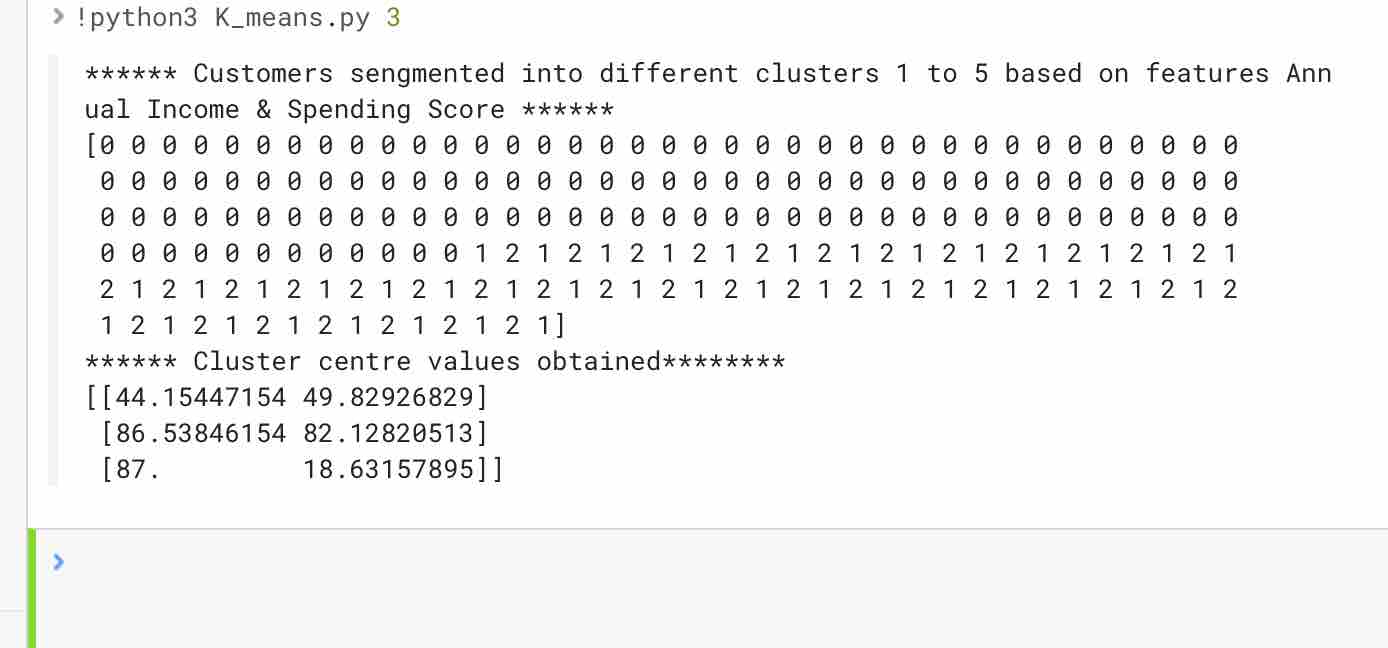
As an example, you can run the K_means.py script to launch the experiment which accepts n_clusters_val as arguments and prints the array of segmented clusters for all the customers in the dataset and also prints the centers of each cluster obtained. You can initially test your script to avoid any errors during running your experiments. You can also launch a session to simultaneously test code changes on the interactive console as you launch new experiments.
To test the script, launch a Python session and run the following command from the workbench command prompt:

Your output should look like below.
Now to run the experiment click on Run > Run Experiment if you are already on an active session. Fill out the fields:
- Script: Provide the script to run the experiment, here we are using K_means.py
- Arguments: This python script accepts n_clusters_val as arguments. Hence, enter the value in this field
- Engine Kernel: For this script you need to choose python3
- Engine Profile: You can leave it as default or can choose your configuration. For this script we are using 1 CPU/ 2 GB memory with no GPU as this is very simple script to run
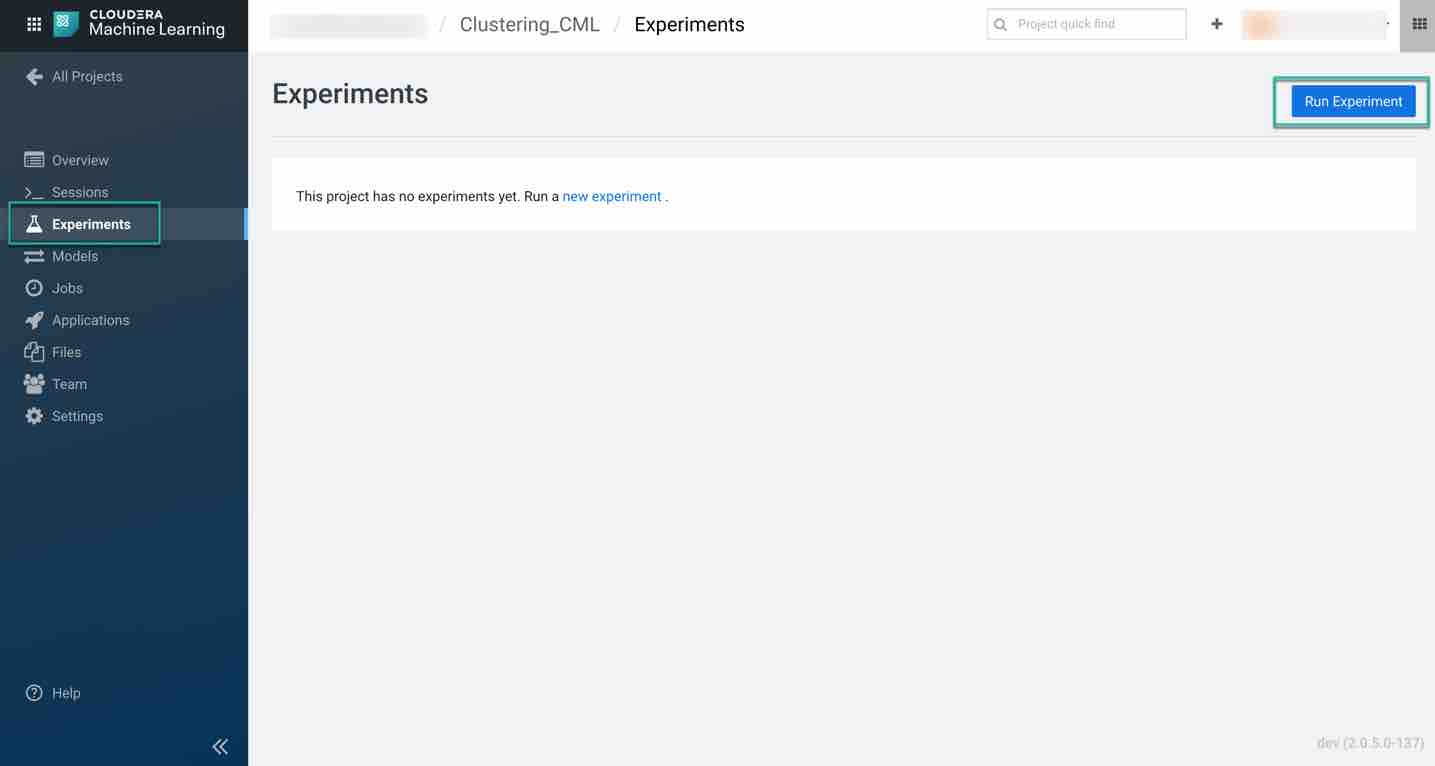
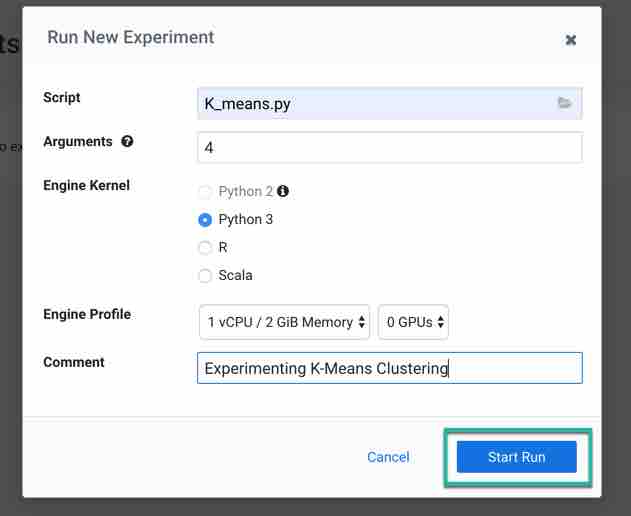
Then click on Start Run to run the experiment and observe the results.
To track progress for the run, go back to the project overview. On the left navigation bar click Experiments. You should see the experiment you've just run at the top of the list.
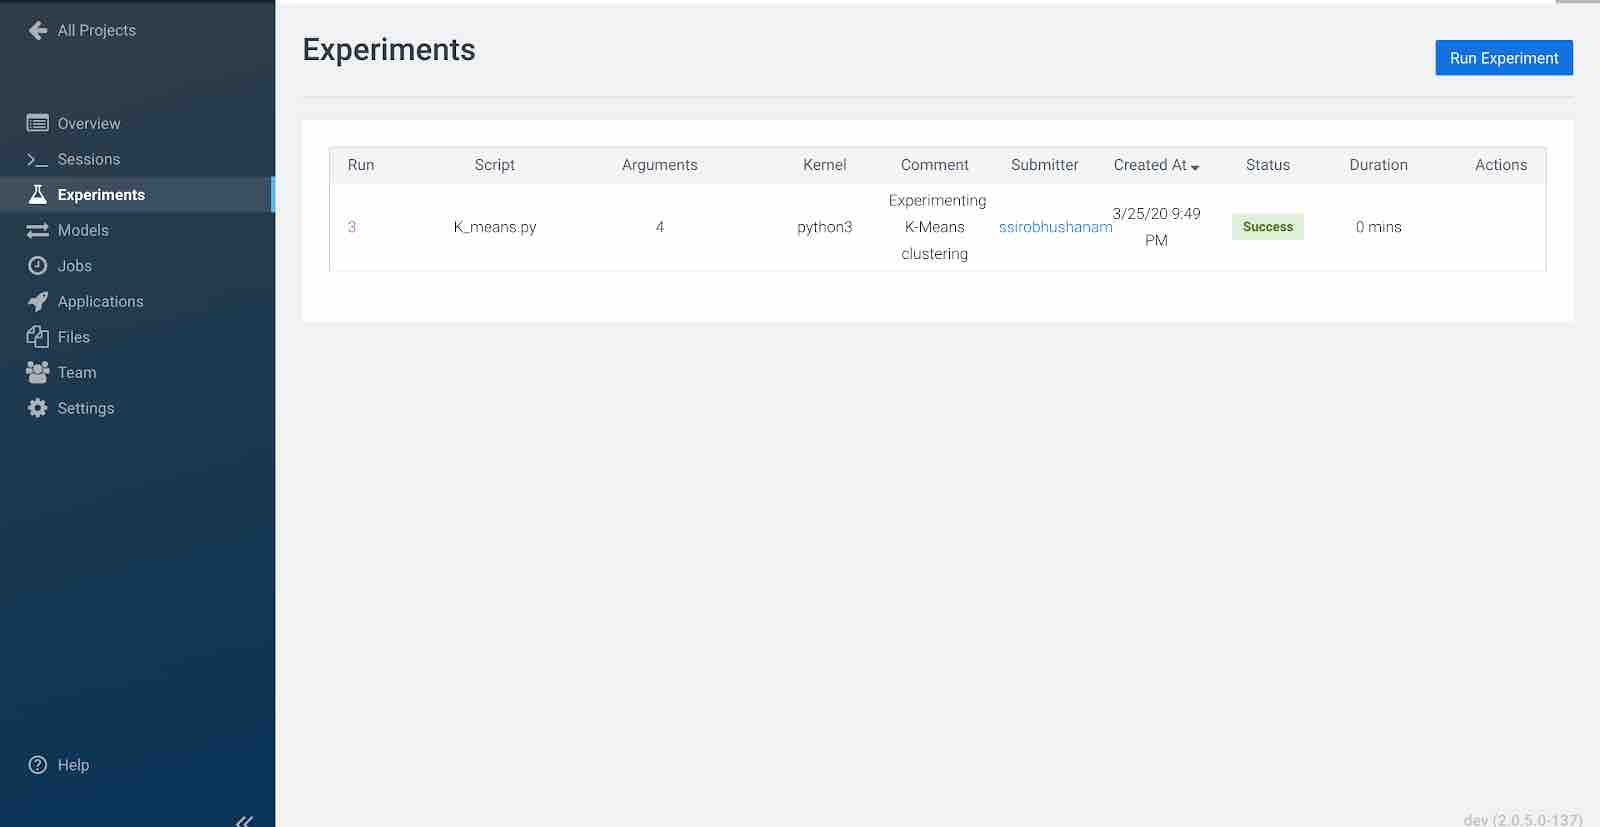
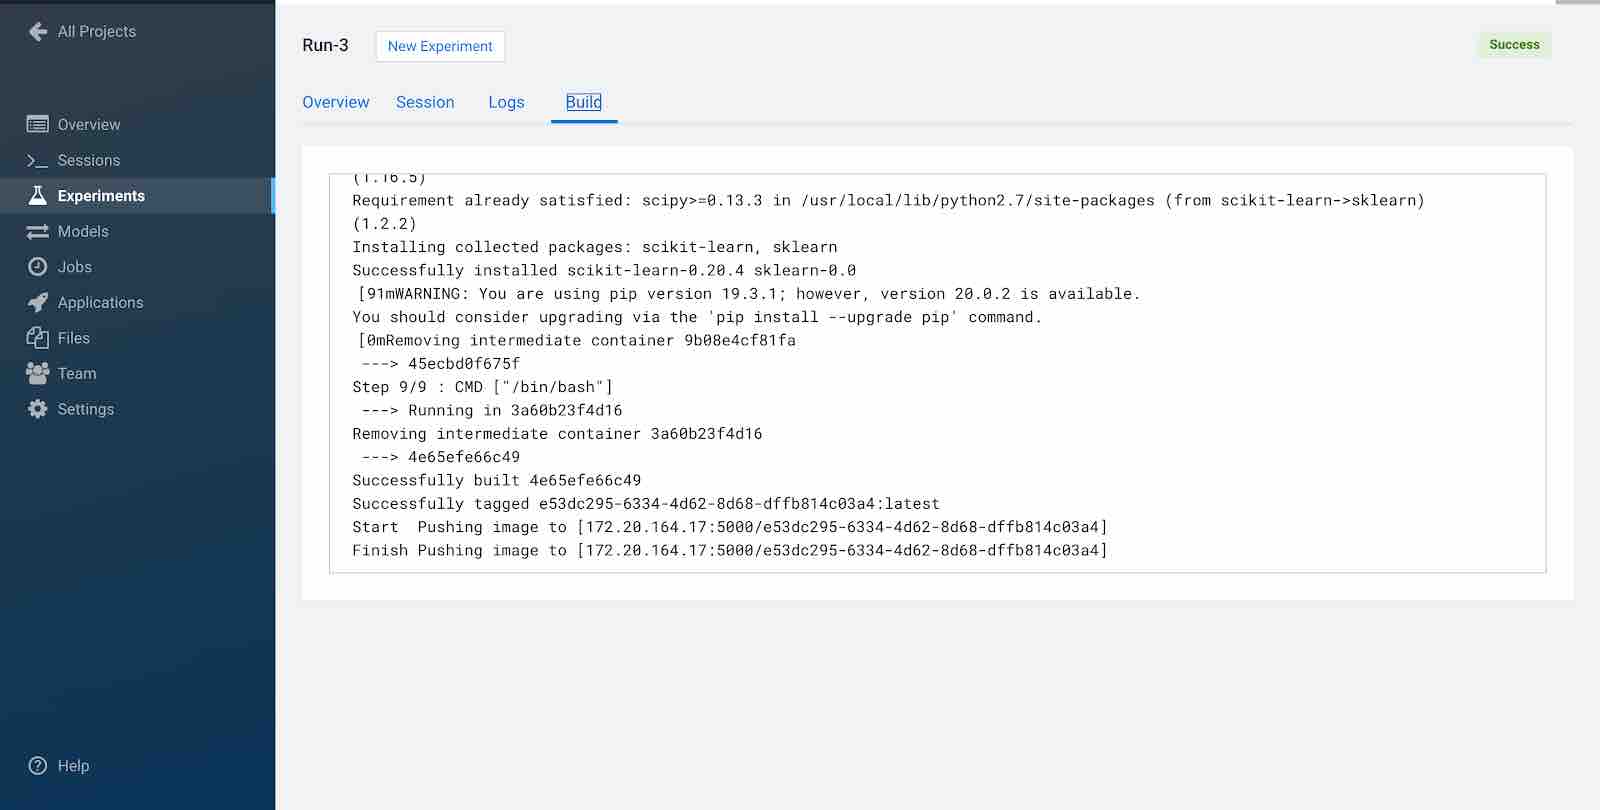
Click on the Run ID to view an overview for each individual run. Then click Build. On this Build tab you can see real time progress as Cloudera AI builds the Docker image for this experiment. This allows you to debug any errors that might occur during the build stage.
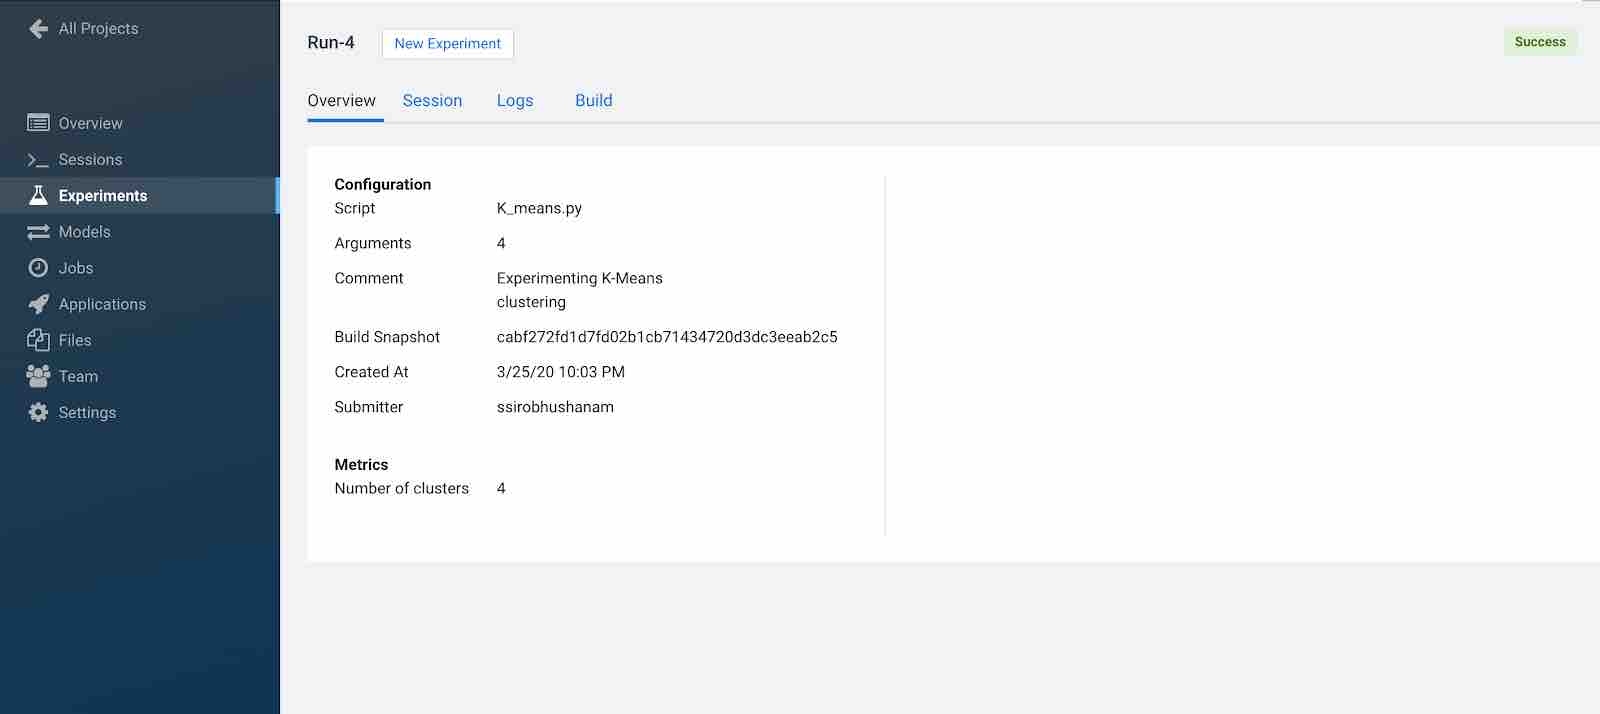
When conducting experiments in real time we are always curious to keep track of metrics useful for tracking the performance of the model. Cloudera AI includes built-in functions that you can use to compare experiments and save any files from your experiments using the Cloudera AI library.
As an example, using the K_means.py script we will include a metric called number of clusters to track the number of clusters (k value) being calculated by the script. In order to perform this, the script imported the Cloudera AI library and added the following line to the script.
As you can observe in the experiments overview page, the metric you have created is being tracked.
Creating jobs using Cloudera AI
In this section we will discuss how built-in jobs can help automate analytics workloads and pipeline scheduling systems that support real time monitoring, job history and email alerts.
Job: A job automates the action of launching an engine, running a script, tracking results all as one batch process and can be configured per your requirements to run on recurring schedule reducing manual intervention. You can also set up email alerts regarding the status of your jobs and attach output files for you and your teammates on regular intervals. Jobs are created within the scope of the project.
Next, create a job using the jobs tab present on the left-hand side bar.
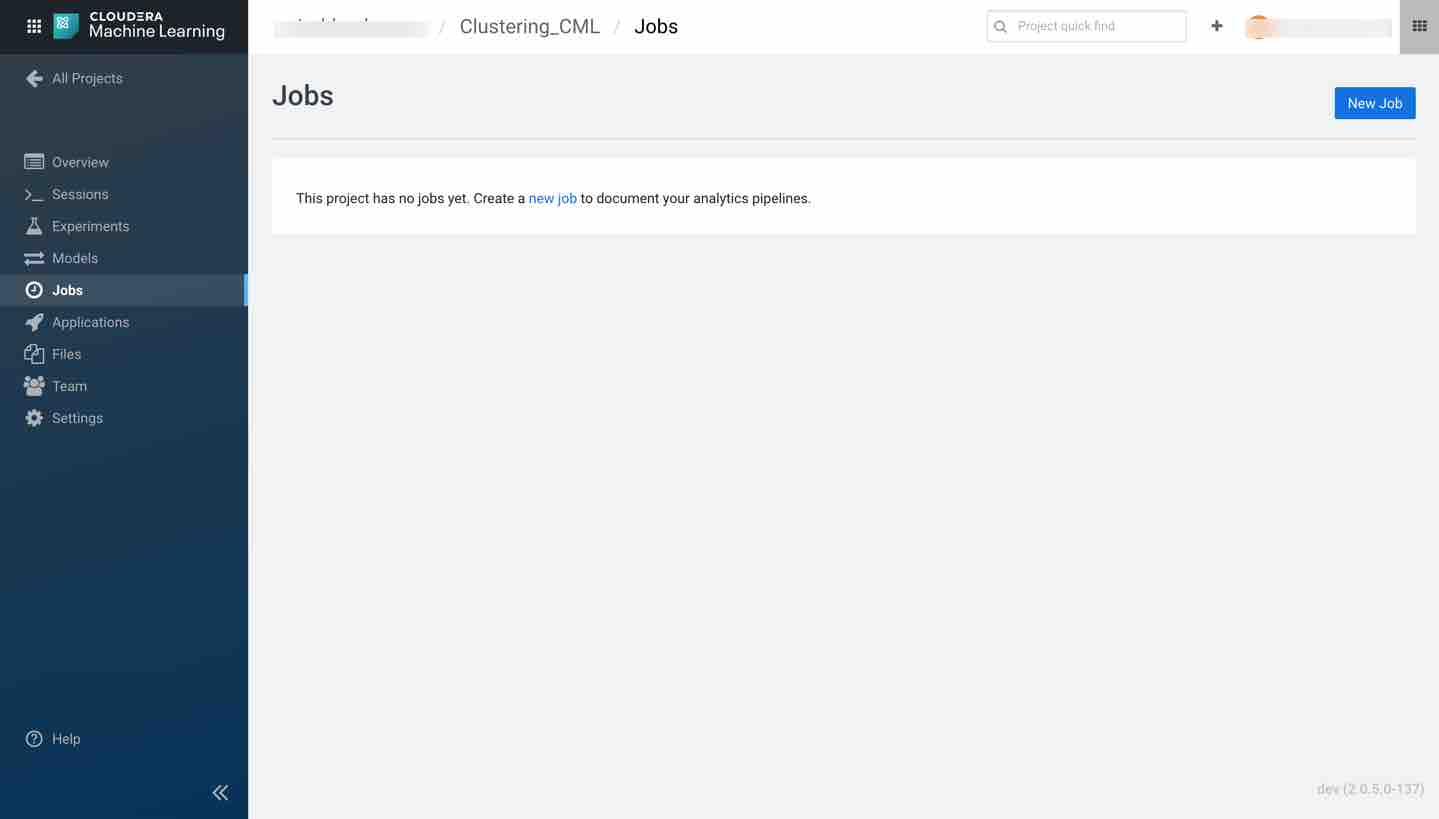
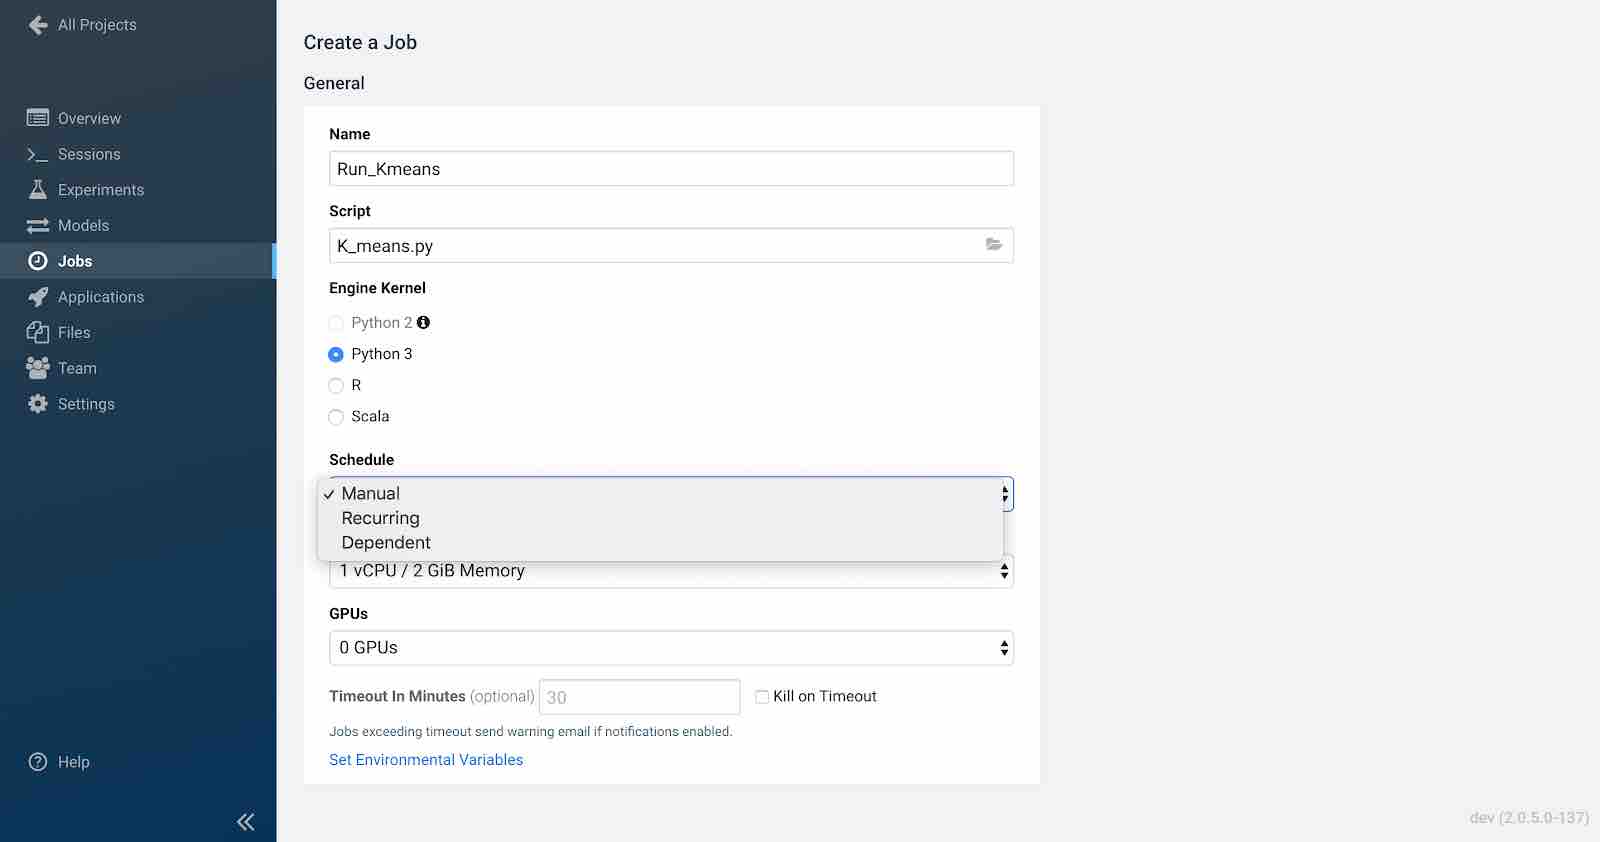
Click New Job and enter the name of the job. Next, select the script to execute by clicking on the folder icon. In this case, select the K_means.py file. Choose the engine kernel as Python3.
Select a Schedule for the job runs from one of the following options.
Manual - Select this option if you plan to run the job manually each time.
Recurring - Select this option if you want the job to run in a recurring pattern every X minutes, or on an hourly, daily, weekly or monthly schedule.
Dependent - Use this option when you are building a pipeline of jobs to run in a predefined sequence. From a dropdown list of existing jobs in this project, select the job that this one should depend on.
For this tutorial we are using a recurring schedule to run every 5 minutes. Select an Engine Profile to specify the number of cores and memory available for each session.
Here we are also specifying any list of Job Report Recipients to whom you can send email notifications with detailed job reports for job success, failure, or timeout. You can send these reports to yourself, your team (if the project was created under a team account), or any other external email addresses. We are not adding any attachments for now but you can add any logs if you want them to send it with the email.
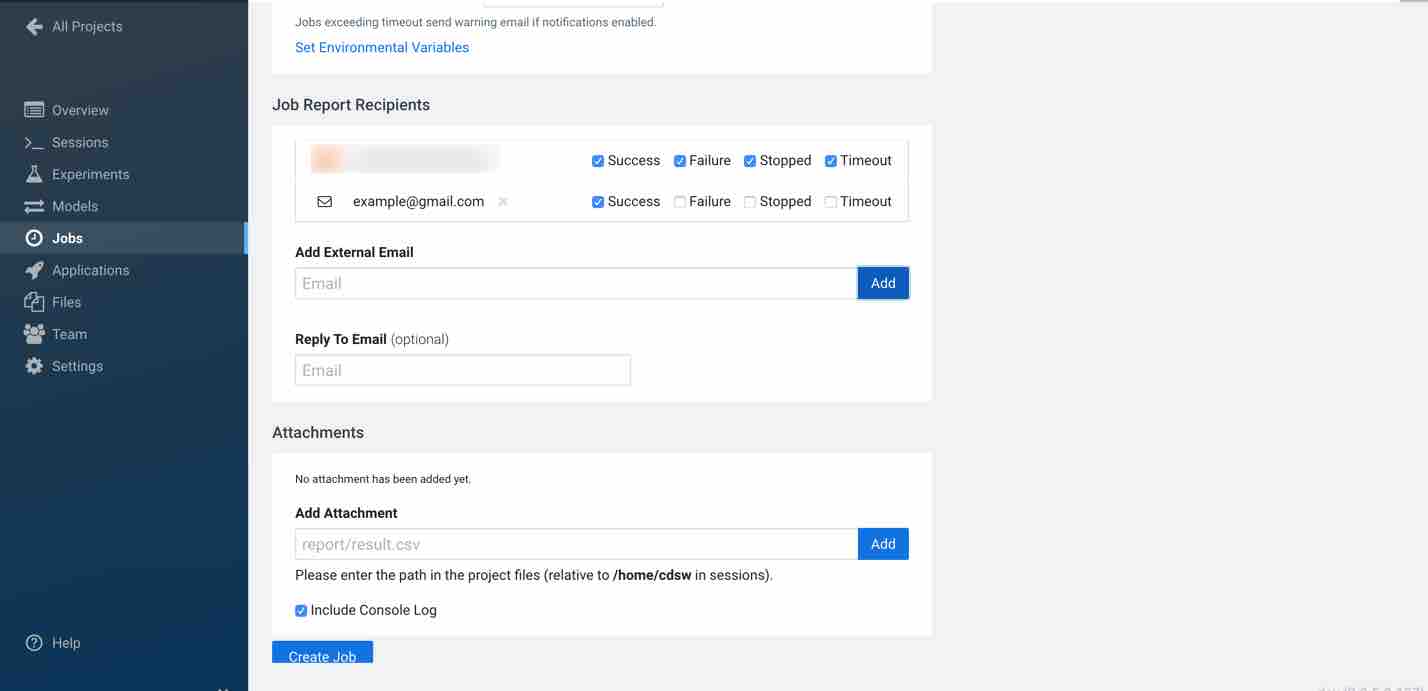
Click Create Job. You should see the job created in the jobs page as shown below.
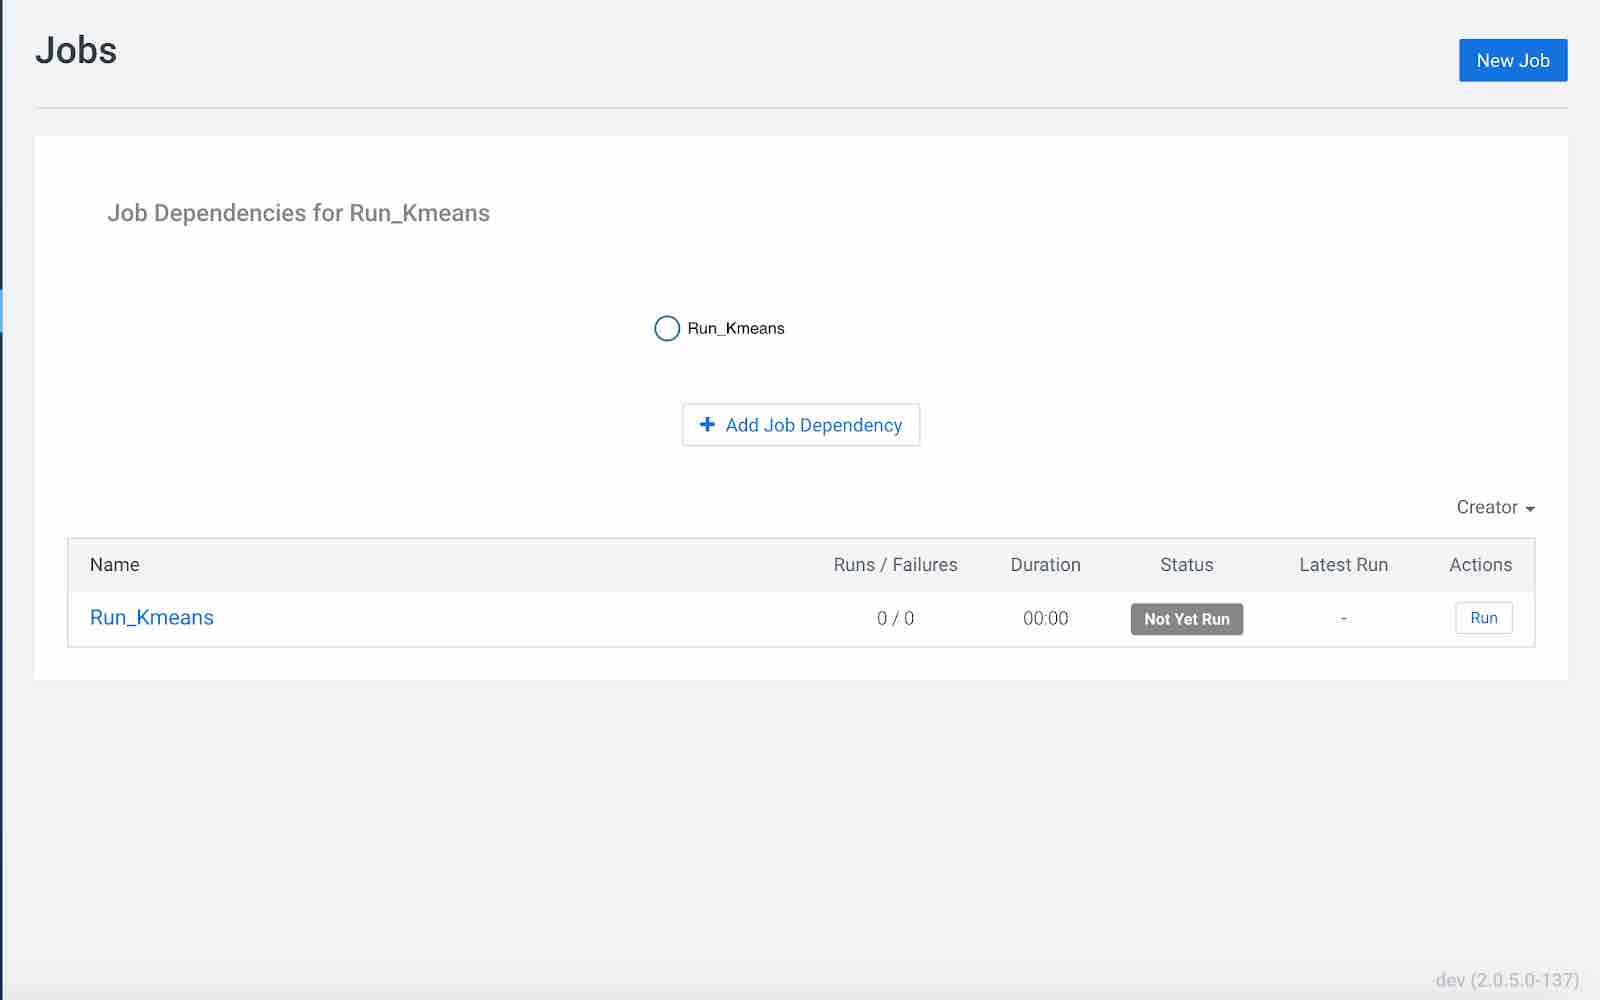
Next, click the Run button on the actions to start running your job. You should see status as success once the job is done.
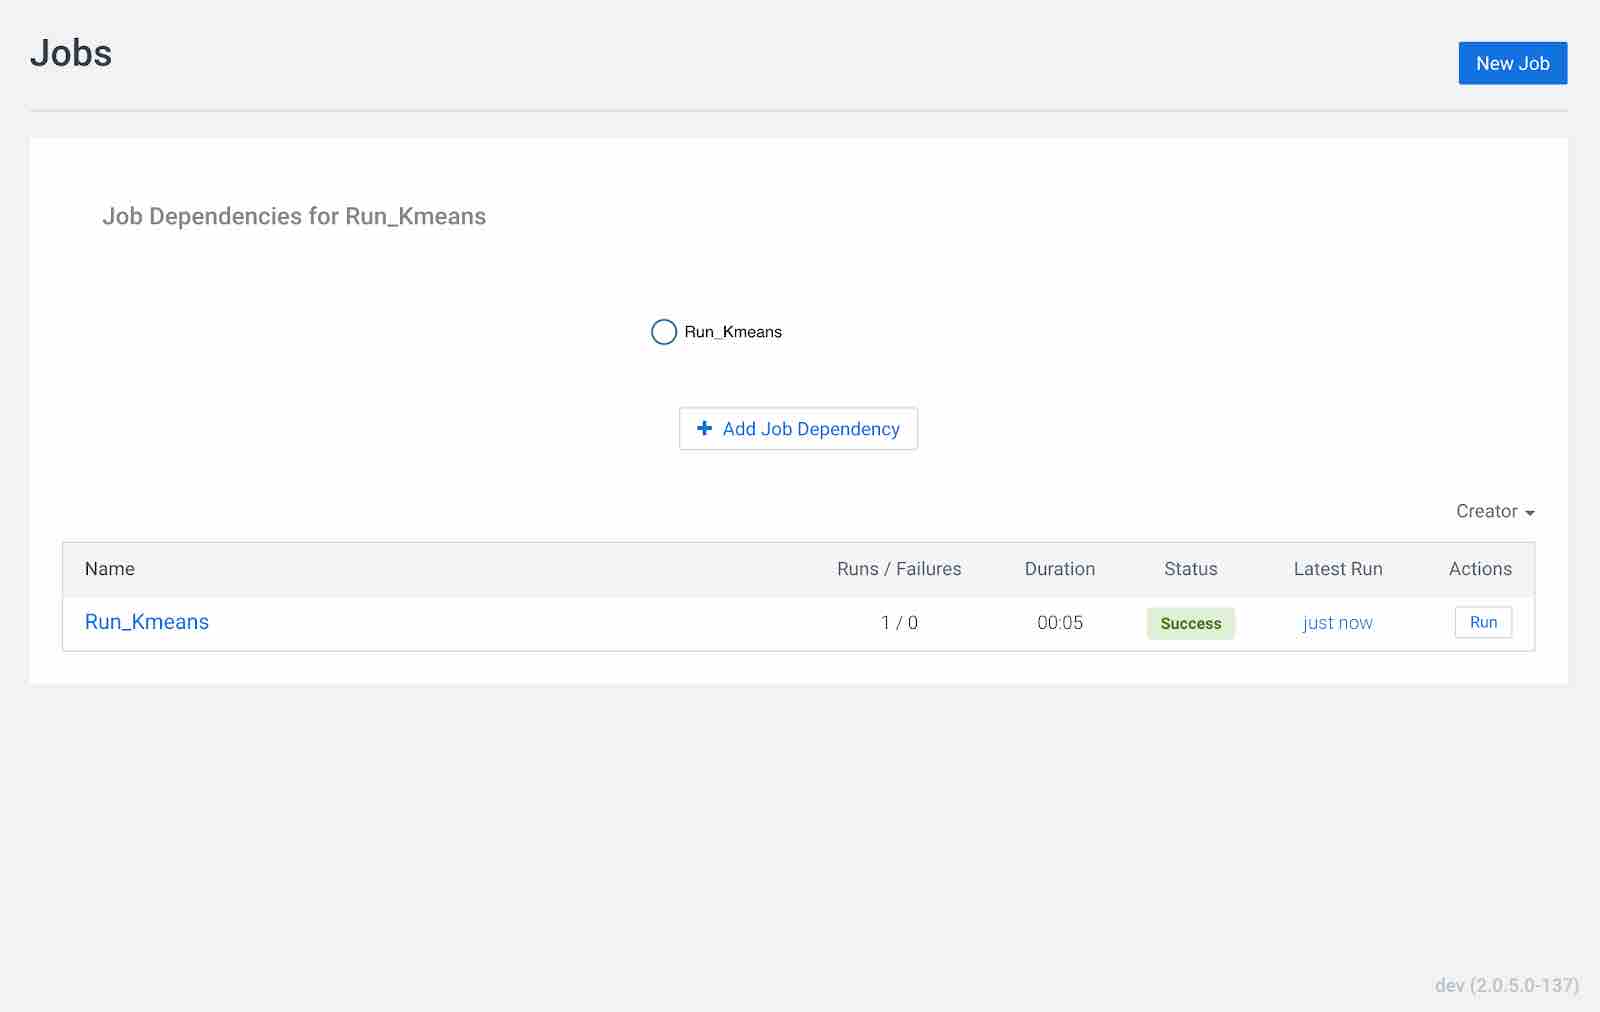
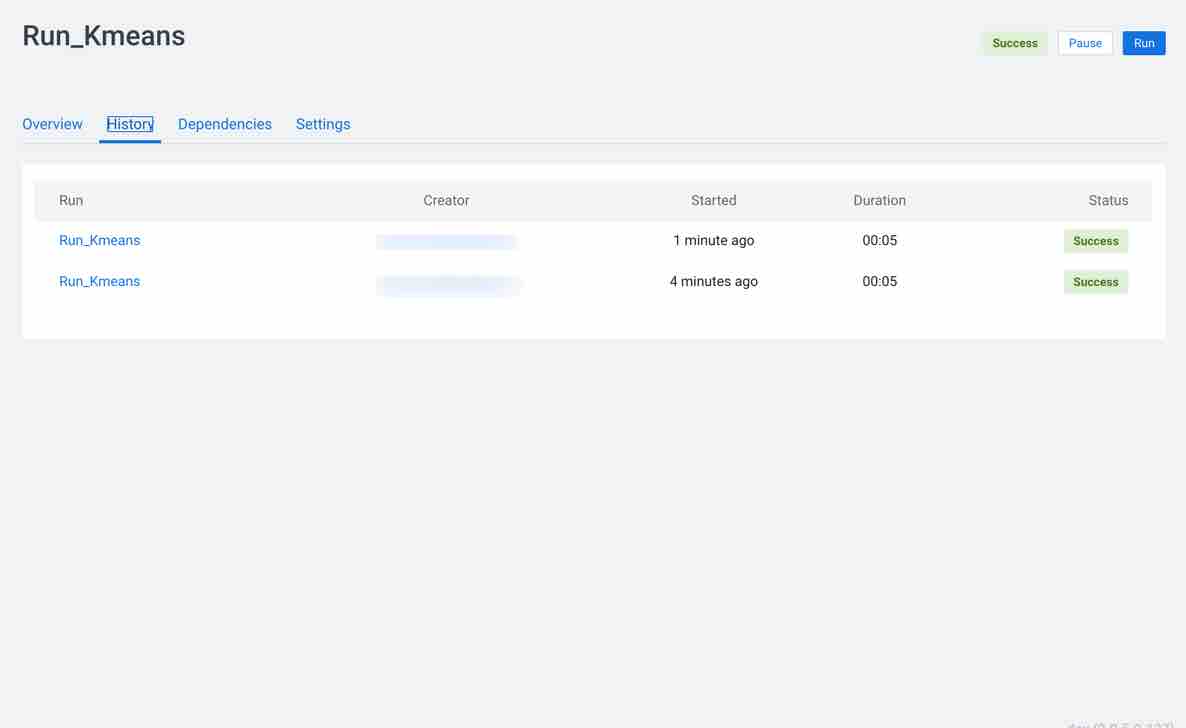
Then click on the job name Run_Kmeans and check the history tab to see if the jobs ran in the past.
Deploying models using Cloudera AI
This section gives information about deploying the model using Cloudera AI. We are using the same script to deploy the model.
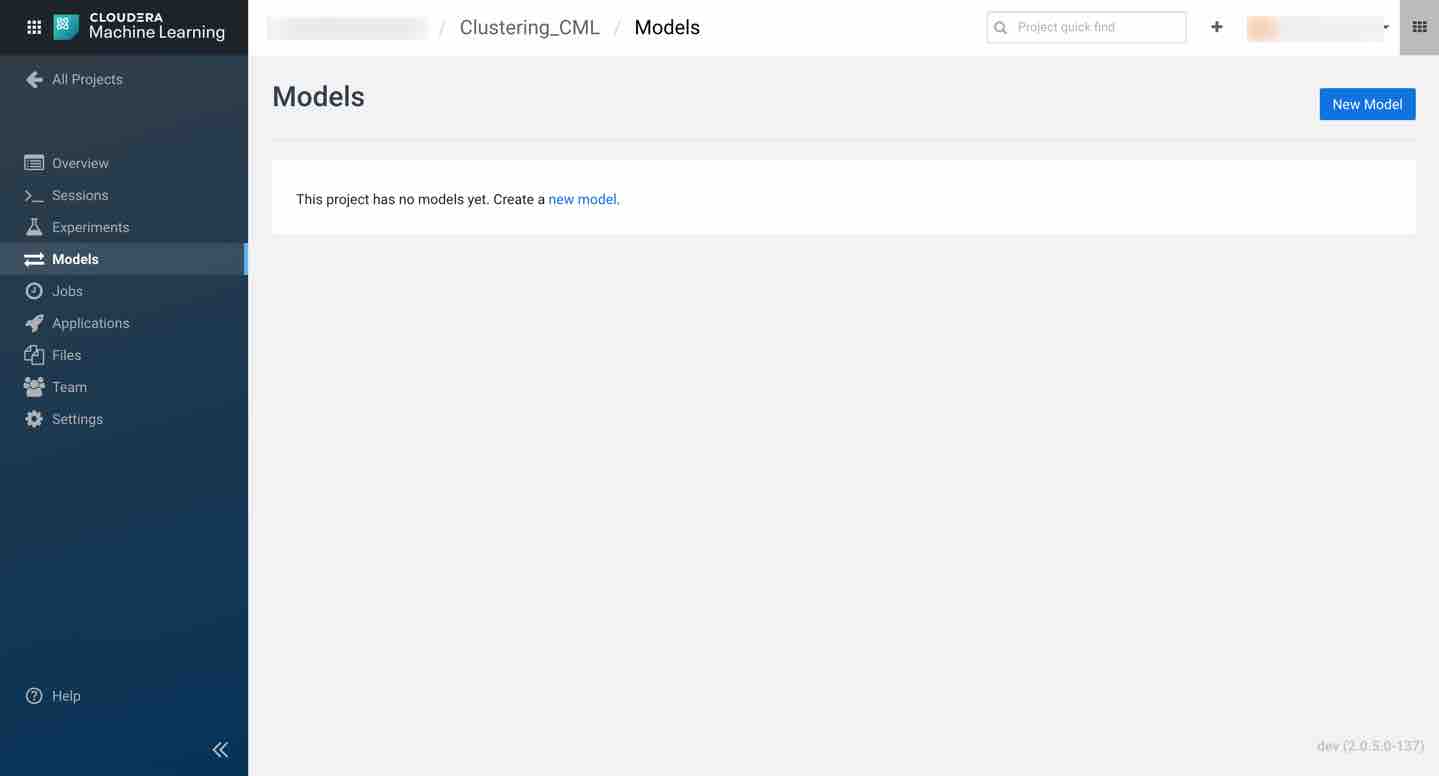
Navigate to the project overview > Models page.
Click New Model and fill out the fields as shown below. Make sure you use the Python 3 kernel. For example, here we are using K_means.py script and, as an example, the input would be the n_clusters_val written in JSON format. You have flexibility to choose the engine profile and GPU capability if needed. Cloudera AI also provides an option to choose replicas for your model that help avoid single point of failure when your models are in production.
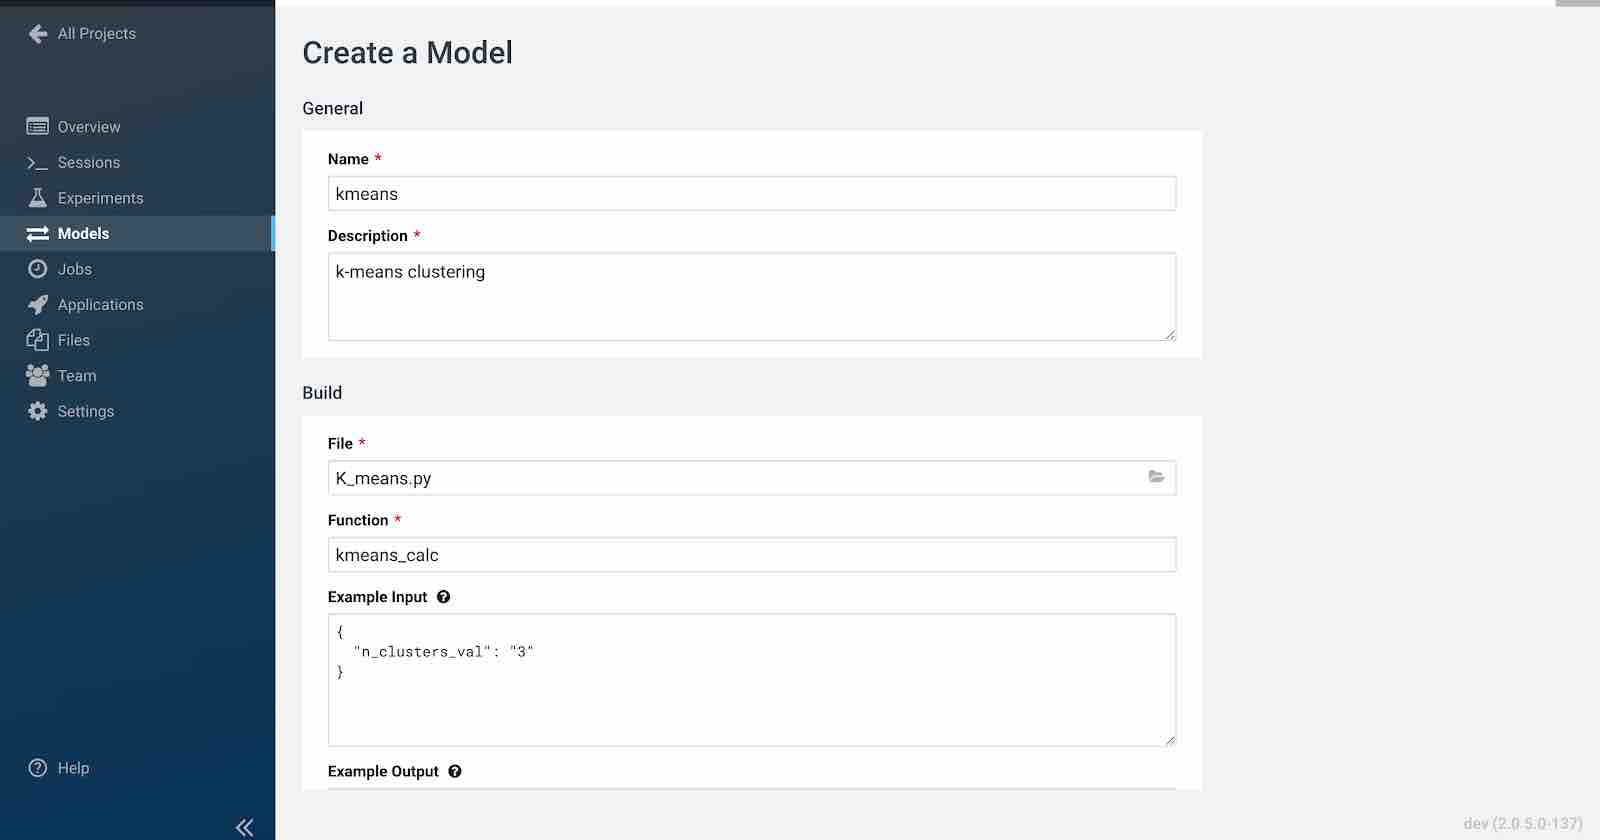
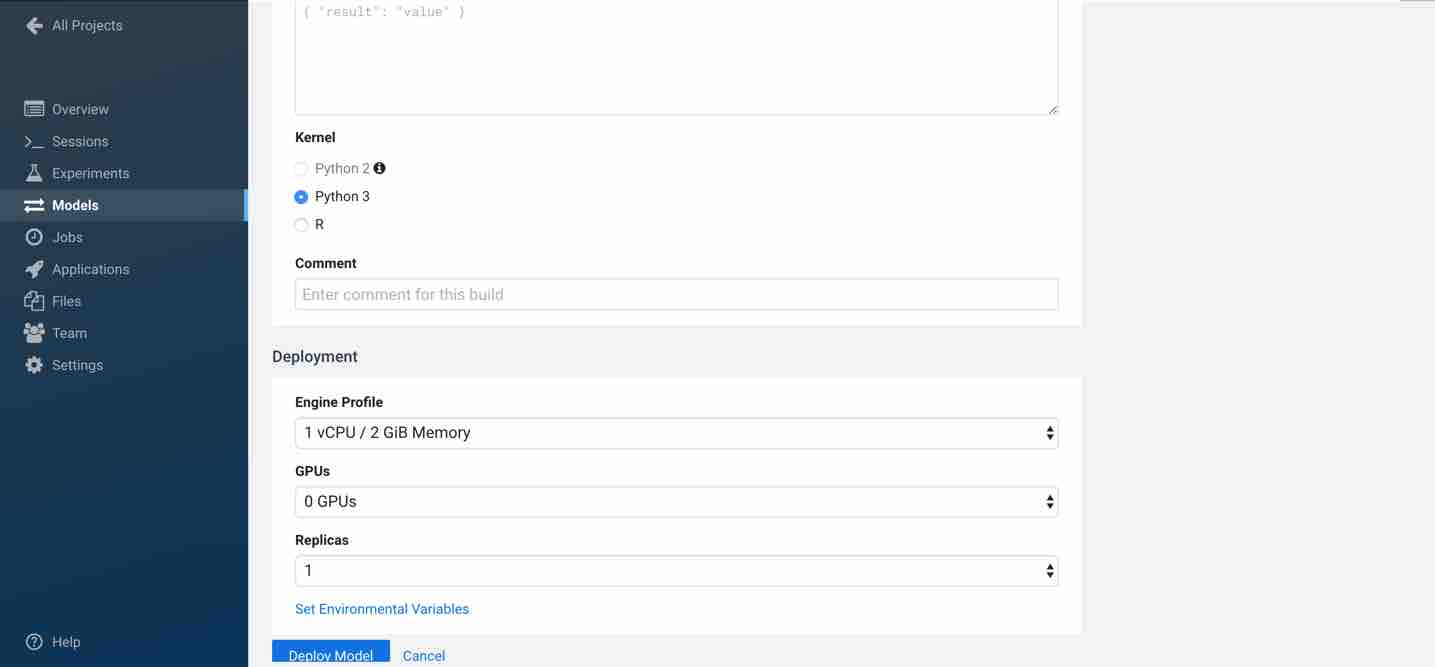
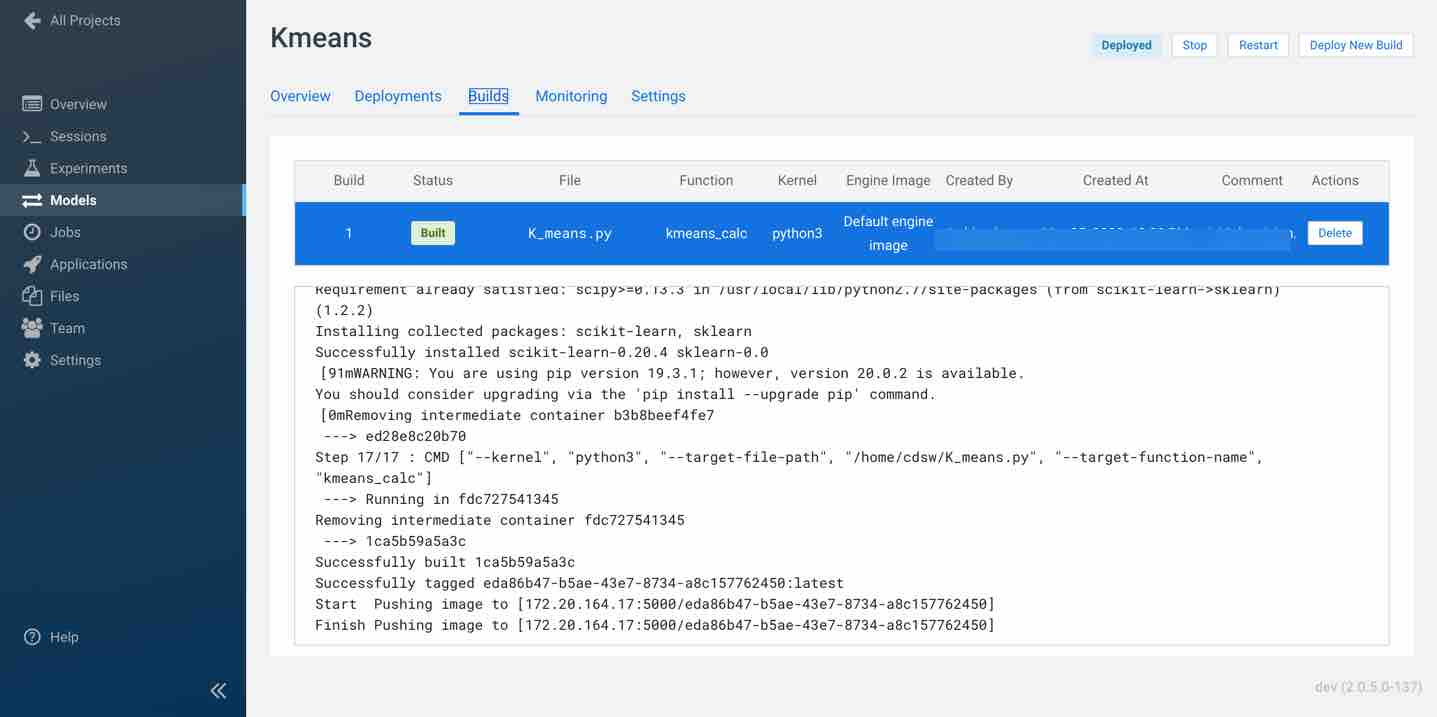
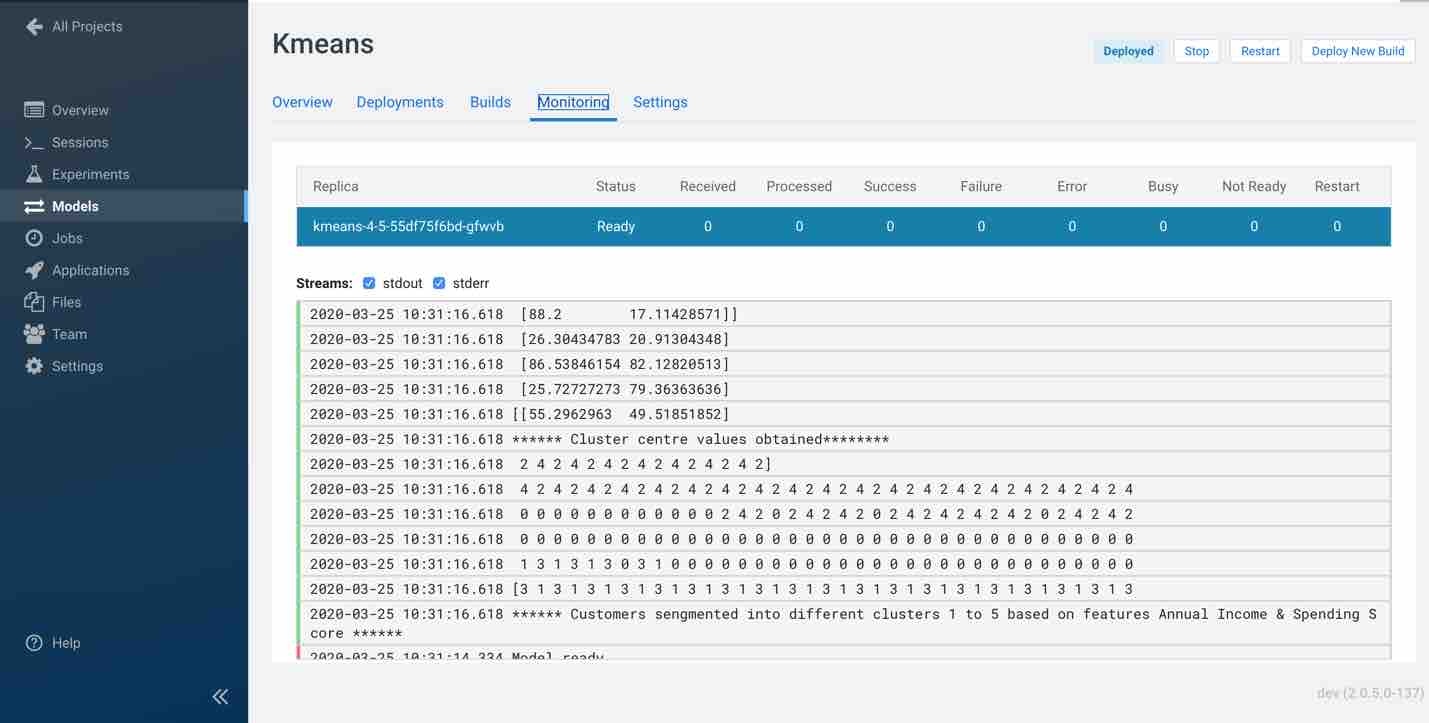
Click Deploy Model. Click on the model to go to its overview page. As the model builds you can track progress on the Build page. Once deployed, you can see the replicas deployed on the Monitoring page.
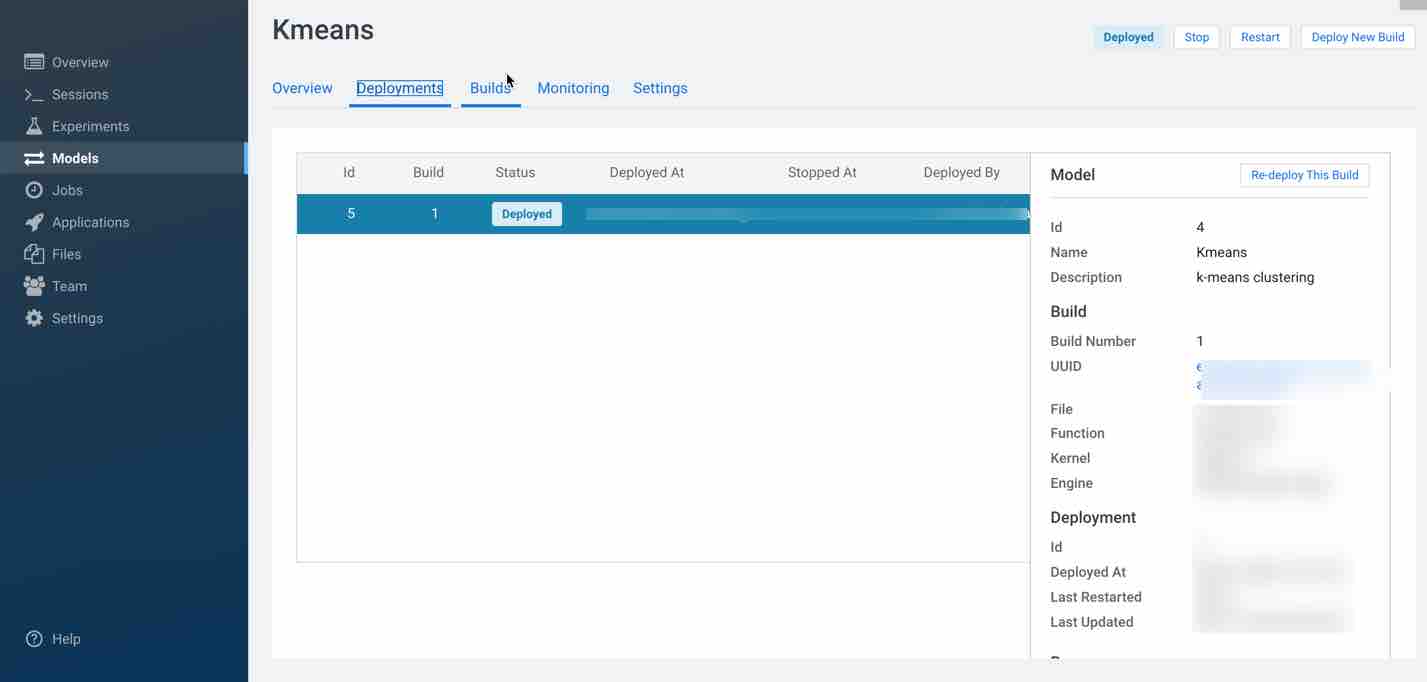
Check Builds tab to track the progress of the model
Monitoring tab provides information about your model, here you can see the replica information, processed, failure, status, errors etc.
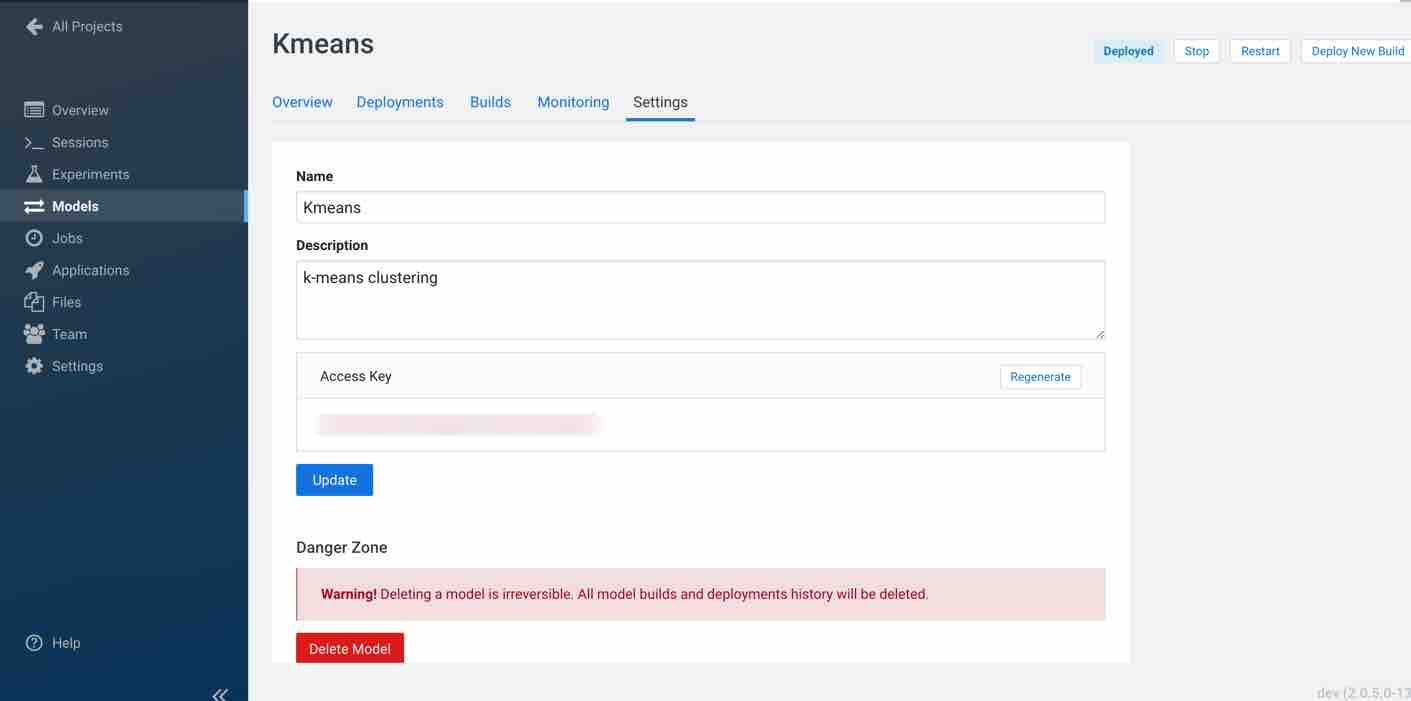
When you click on settings, you also have an option to delete your model.
