Introduction
Learn to quickly visualize datasets and create stunning dashboards using Cloudera Data Visualization on Cloudera on cloud.
Cloudera Data Visualization enables data engineers, business analysts, and data scientists to quickly and easily explore data, collaborate, and share insights across the data lifecycle.
Prerequisites
- Have access to Cloudera on cloud environment
- Have created a Cloudera workload User
- Basic AWS CLI skills
Download assets
There are two (2) options in getting assets for this tutorial:
It contains only necessary files used in this tutorial. Unzip tutorial-files.zip and remember its location.
It provides assets used in this and other tutorials; organized by tutorial title.
Using AWS CLI, copy the following data file to your S3 bucket, defined by your environment’s storage.location.base attribute:
shipping-data.csv
For example, property storage.location.base has value s3a://usermarketing-cdp-demo; we will copy the file using the command:
aws s3 cp shipping-data.csv s3://usermarketing-cdp-demo/tutorial-data/shipping-data.csv
Note: shipping dataset is publicly available on Kaggle.

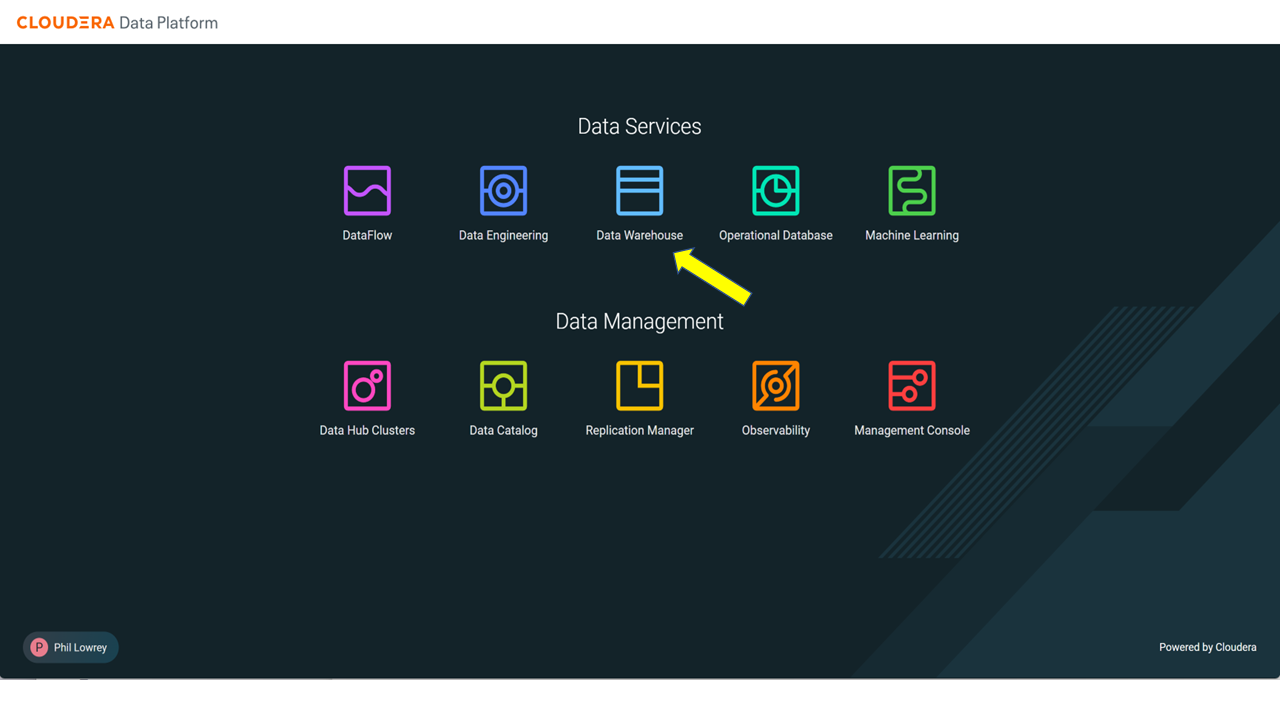
Locate your environment by using the filter. If you see ![]() next to the environment name, no need to activate it because it's already been activated and running.
next to the environment name, no need to activate it because it's already been activated and running.
Otherwise, click on ![]() to activate the environment. This will create the default database catalog, environment_name-default.
to activate the environment. This will create the default database catalog, environment_name-default.
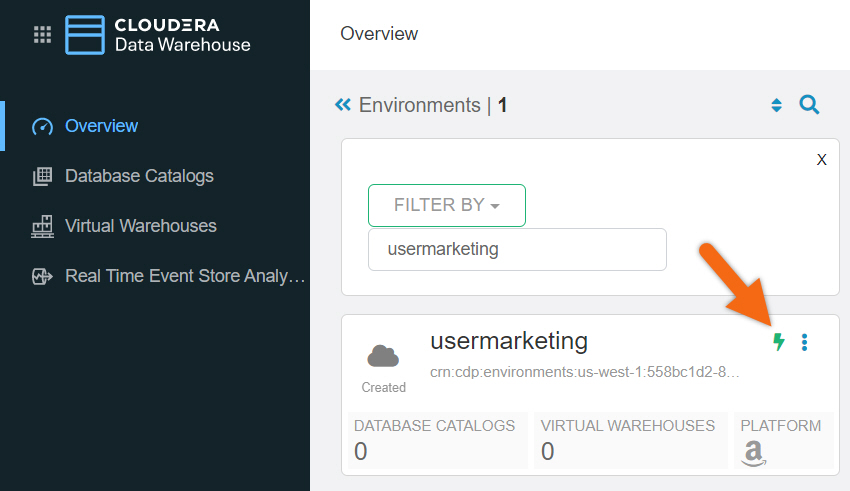
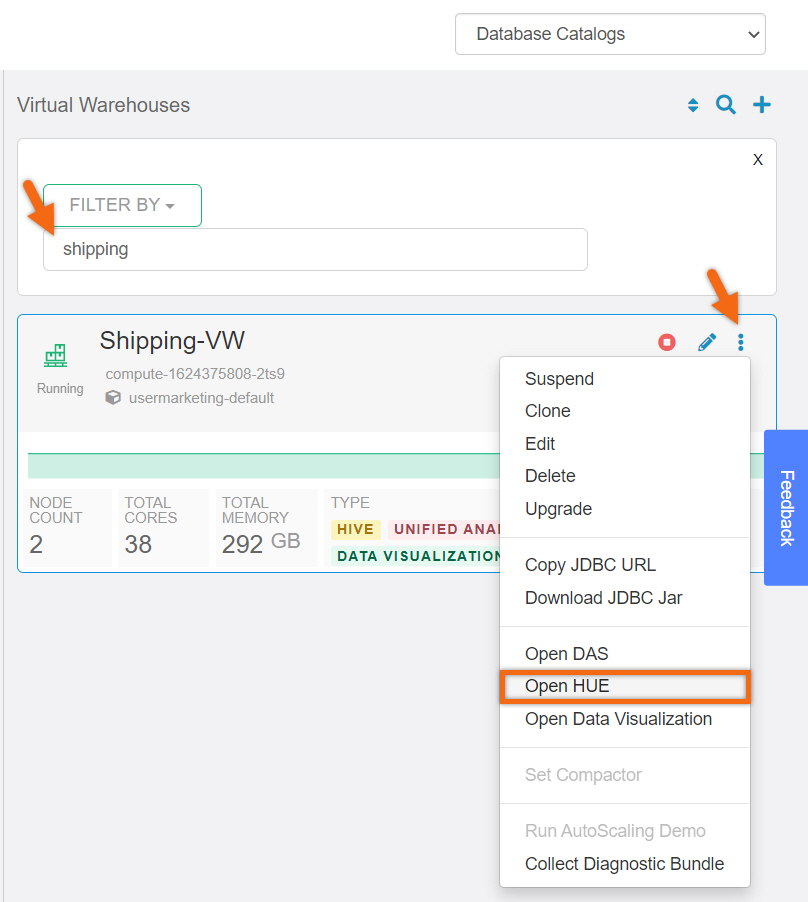
Now that the environment has been activated, in the Virtual Warehouse section, select ![]() to create a virtual warehouse:
to create a virtual warehouse:
- Name:
Shipping-VW - Type: HIVE
- Database Catalog: environment_name-default
- Size: xsmall - 2 Executor Nodes
- AutoSuspend Timeout: 300 seconds
- Nodes: Min: 2, Max: 4
- Install Data Visualization
- CREATE
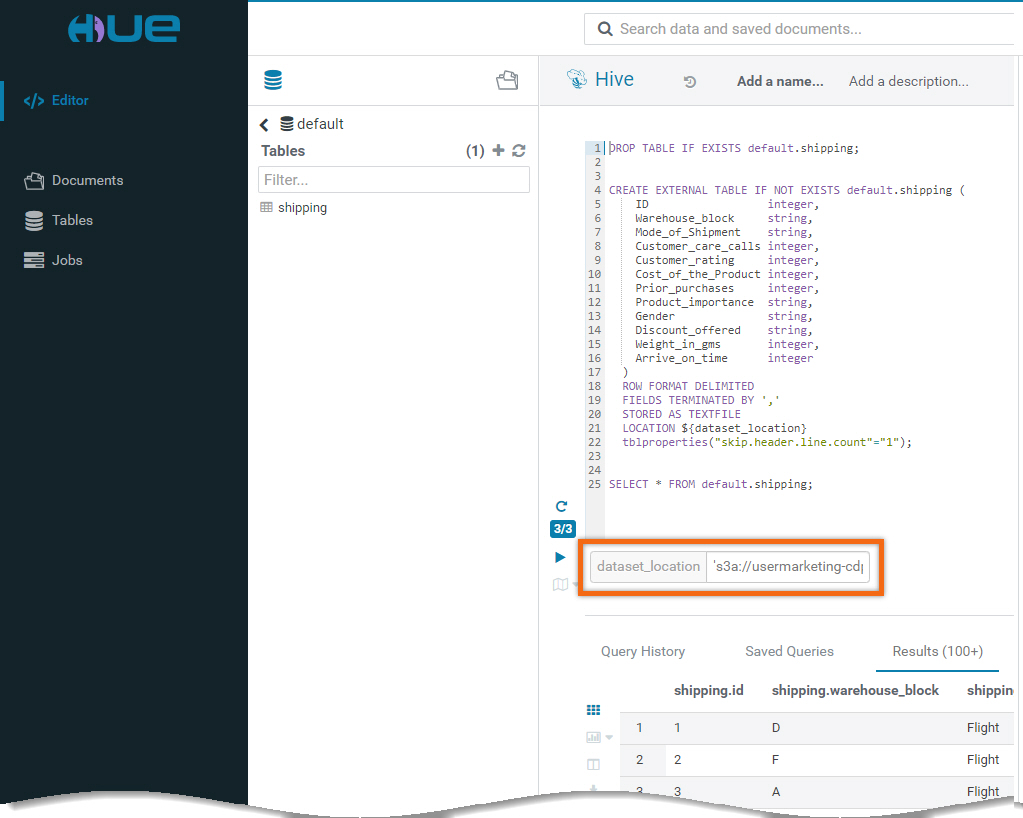
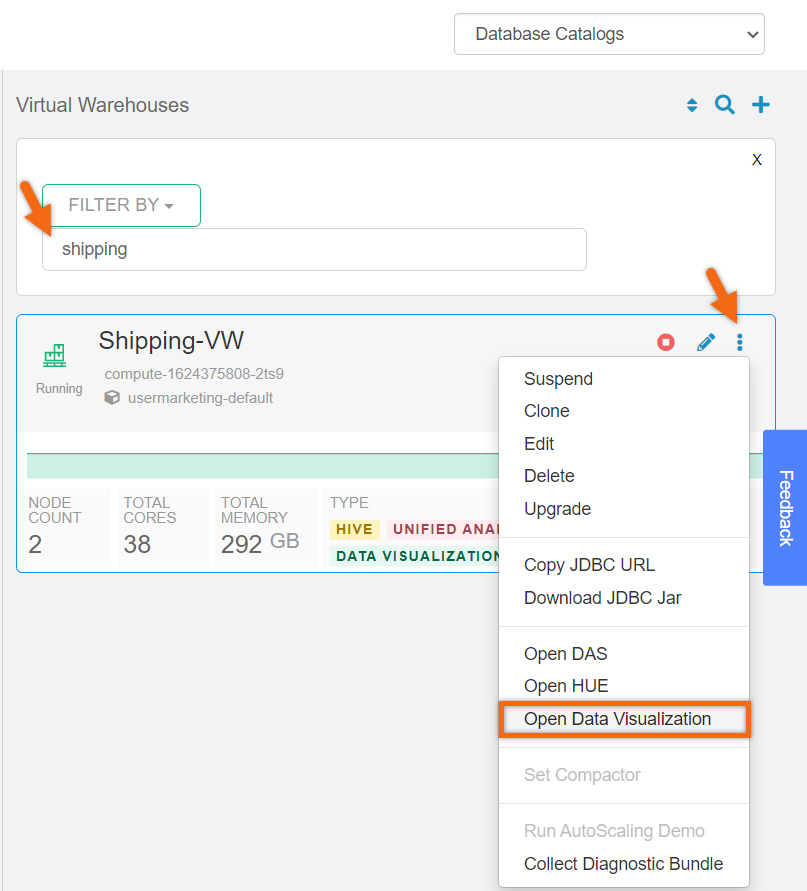
Now that we have Cloudera Data Explorer opened, select </> Editor, copy-paste the following SQL statements onto the worksheet, make one modification and execute it:
DROP TABLE IF EXISTS default.shipping;


CREATE EXTERNAL TABLE IF NOT EXISTS default.shipping (
    ID                  integer,
    Warehouse_block     string,
    Mode_of_Shipment    string,
    Customer_care_calls integer,
    Customer_rating     integer,
    Cost_of_the_Product integer,
    Prior_purchases     integer,
    Product_importance  string,
    Gender              string,
    Discount_offered    string,
    Weight_in_gms       integer,
    Arrive_on_time      integer
  )
  ROW FORMAT DELIMITED
  FIELDS TERMINATED BY ','
  STORED AS TEXTFILE
  LOCATION ${dataset_location}
  tblproperties("skip.header.line.count"="1");


SELECT * FROM default.shipping;
IMPORTANT: You need to provide the value for variable named, dataset_location. Set the value to the location of the dataset you specified when you downloaded the dataset. For example, 's3a://usermarketing-cdp-demo/tutorial-data/'.
Create dataset using table data
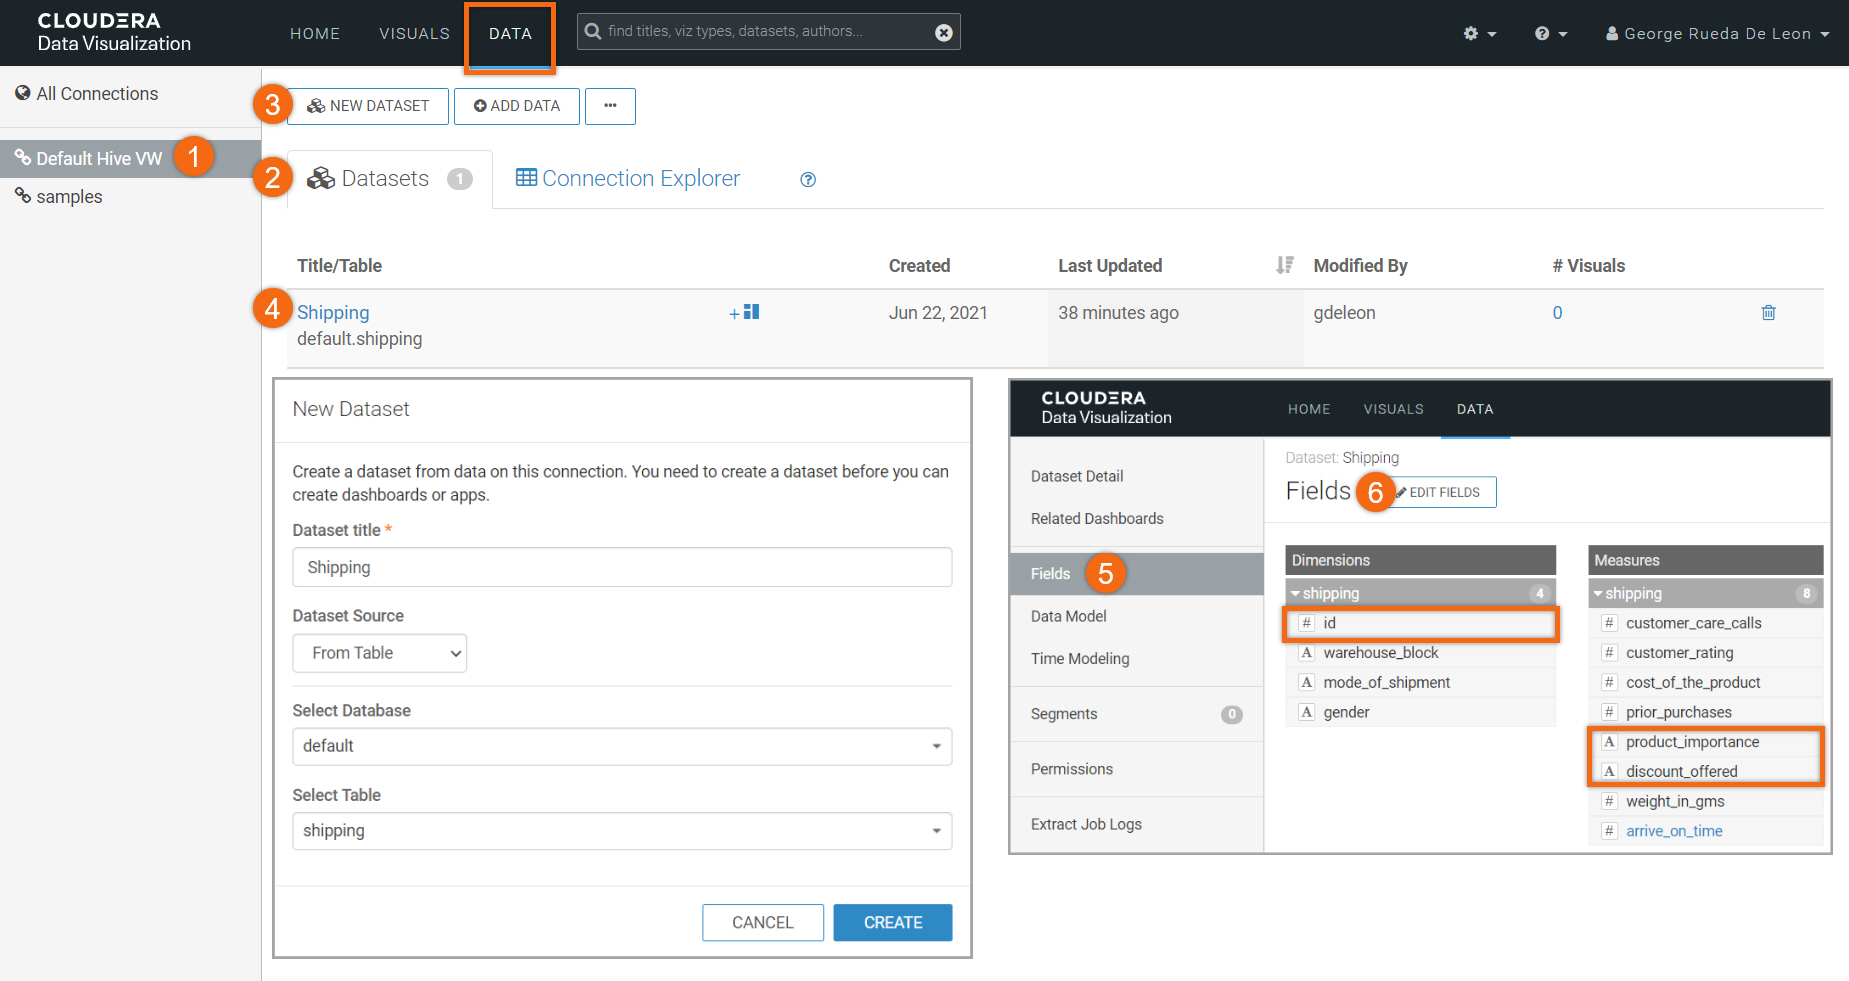
Starting from Cloudera Data Visualization home page, select DATA.
- Select Default Hive VW connection
- Select Datasets tab
- Select NEW DATASET
Create New dataset using table source:
Dataset Title: Shipping
Dataset Source: From Table
Select Database: default
Select Table: shipping
Edit dataset to adjust Dimensions/Measures:
- Select dataset named Shipping
- Select Fields
- Select EDIT FIELDS
Modify product_importance as a Measure
Modify discount_offered as a Measure
Modify id as a Dimension
Click on SAVE

Let’s build the Dashboard.
- Select VISUALS
- Select NEW DASHBOARD

We will use:
Title: Shipping Dashboard Example
Subtitle: Visually appealing representation of shipping data
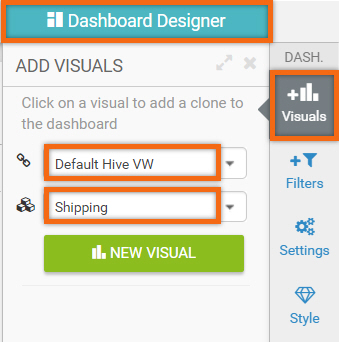
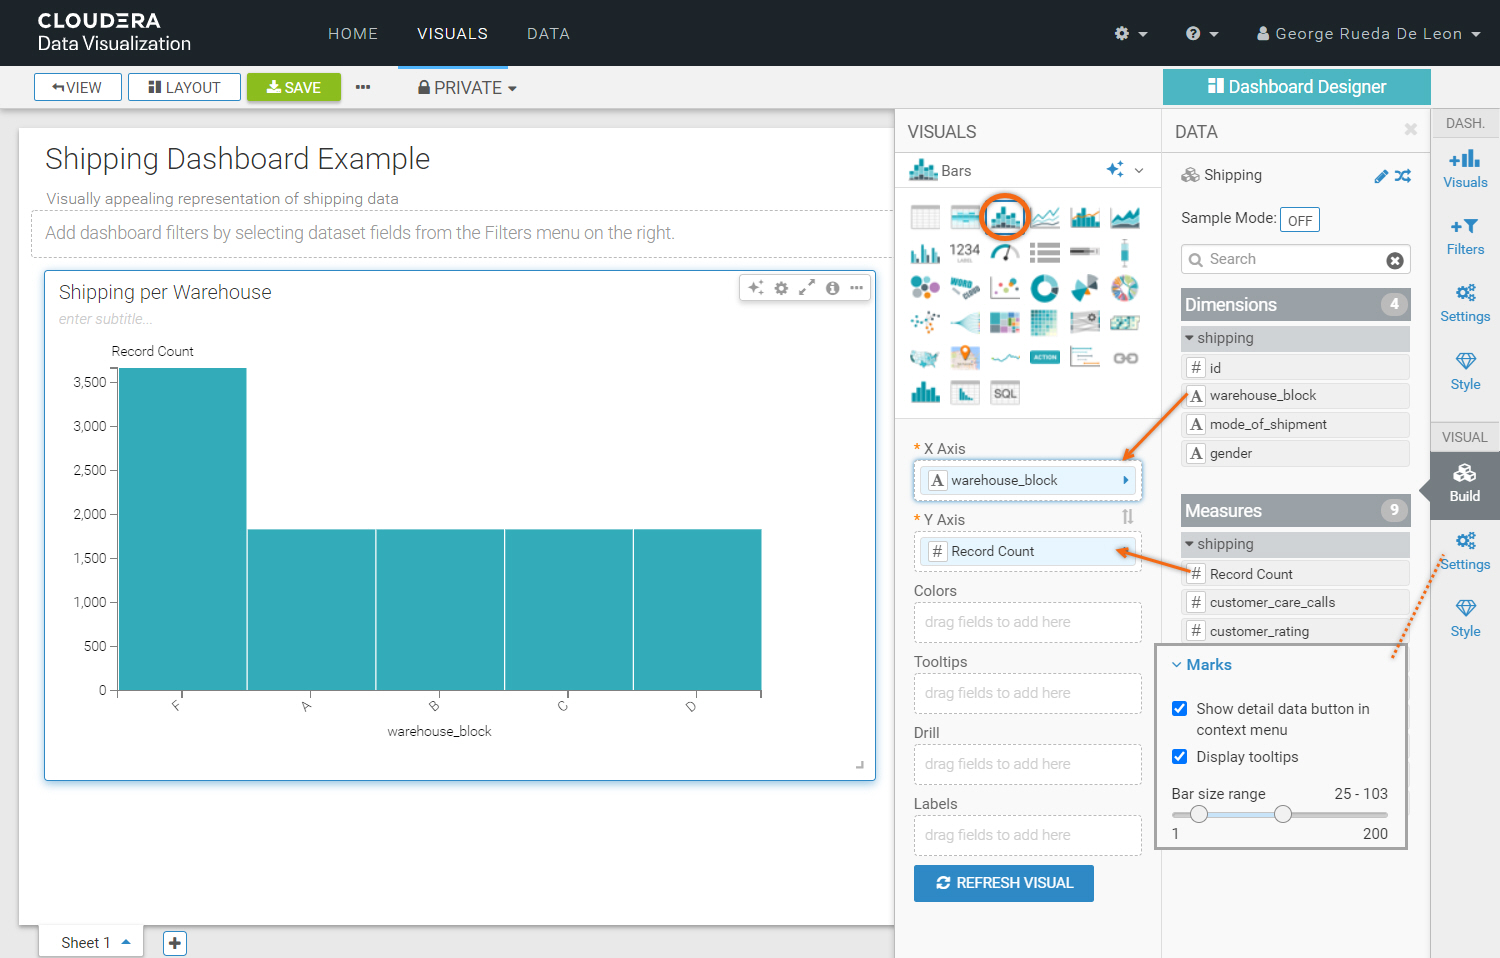
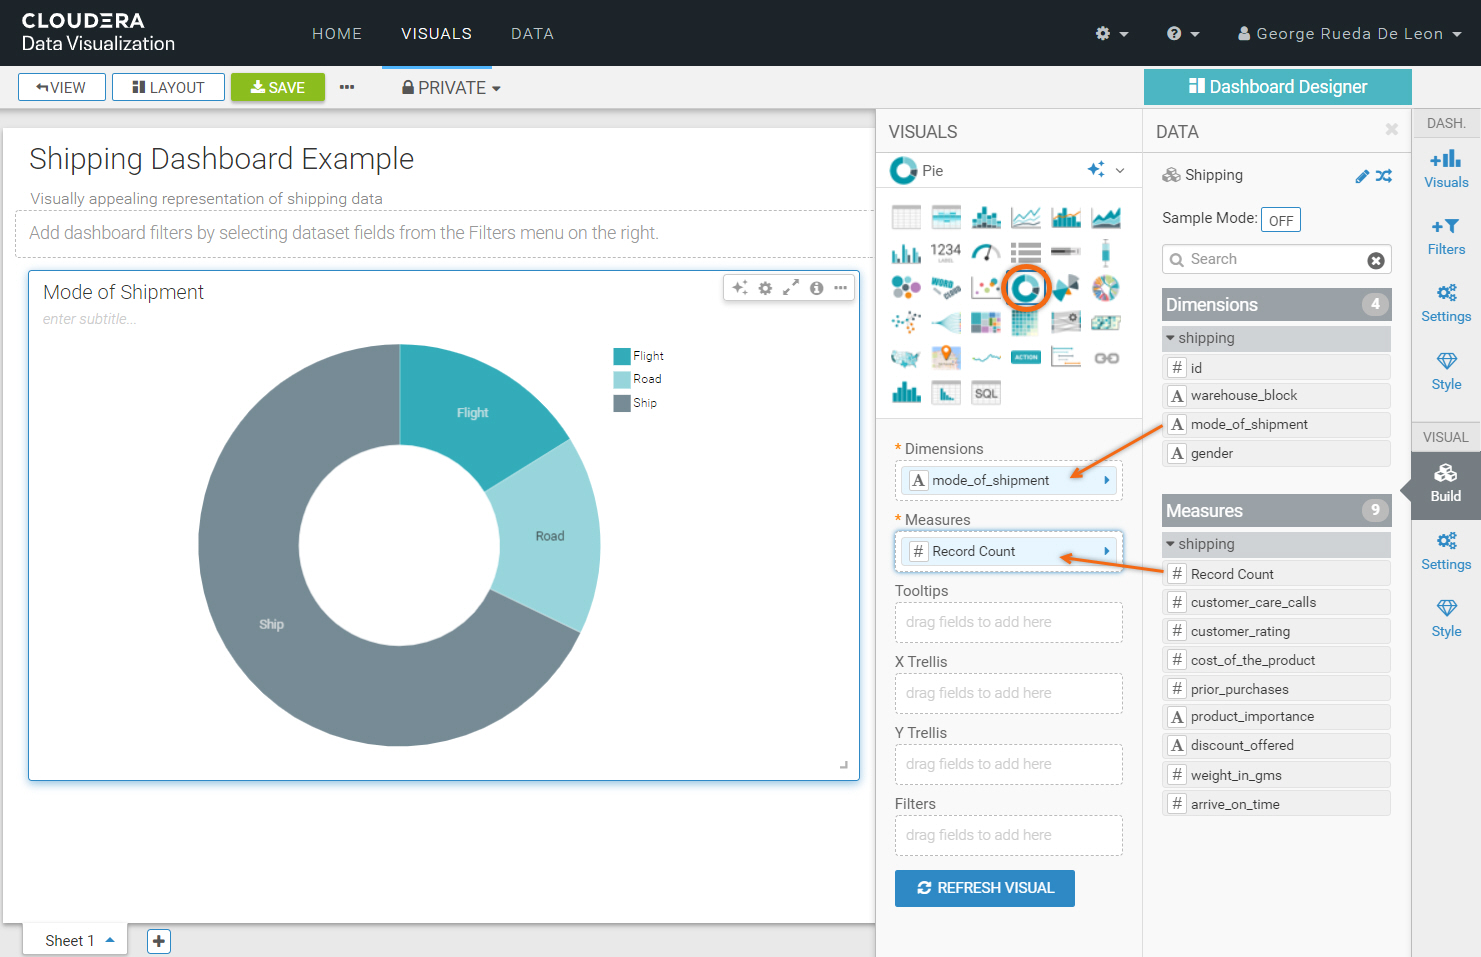
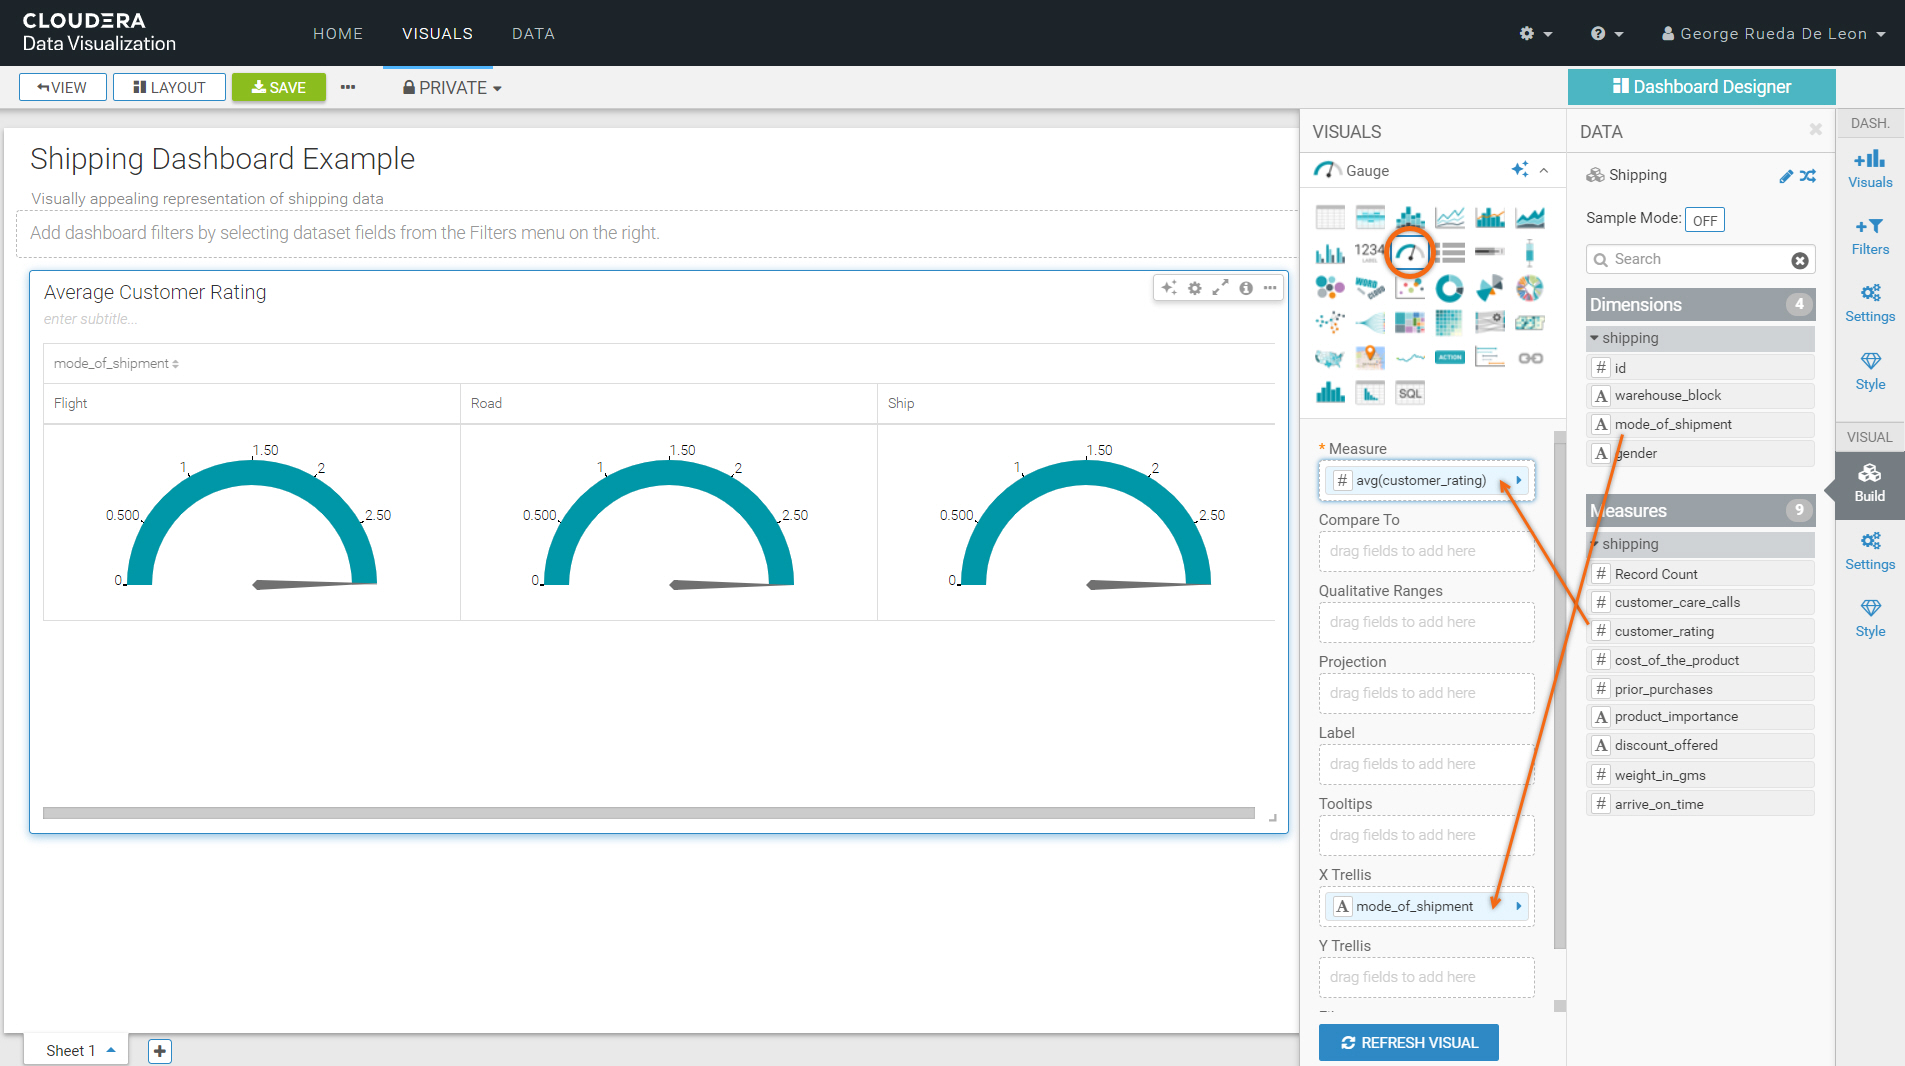
In Dashboard Designer, select the Visuals tab. We are going to create four (4) new visuals using the Default Hive VW connection and Shipping dataset.
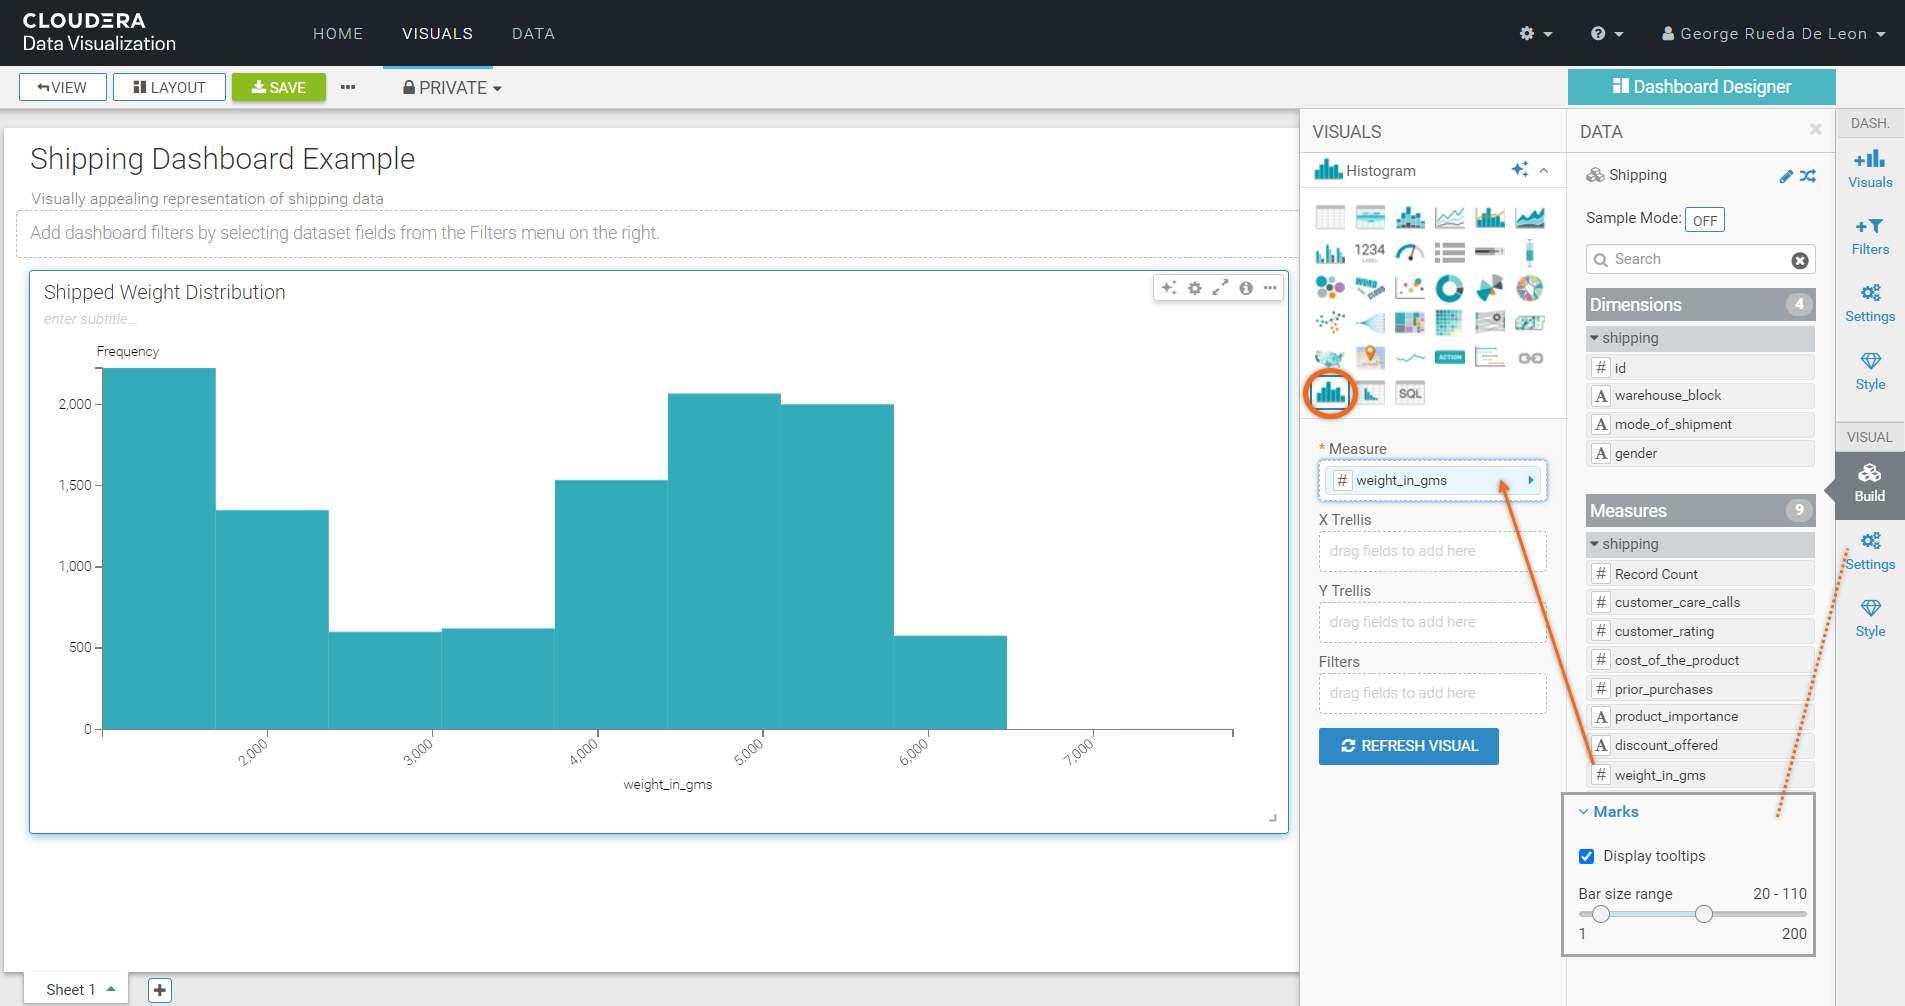
We are done creating our dashboard. To save it, click on Save.
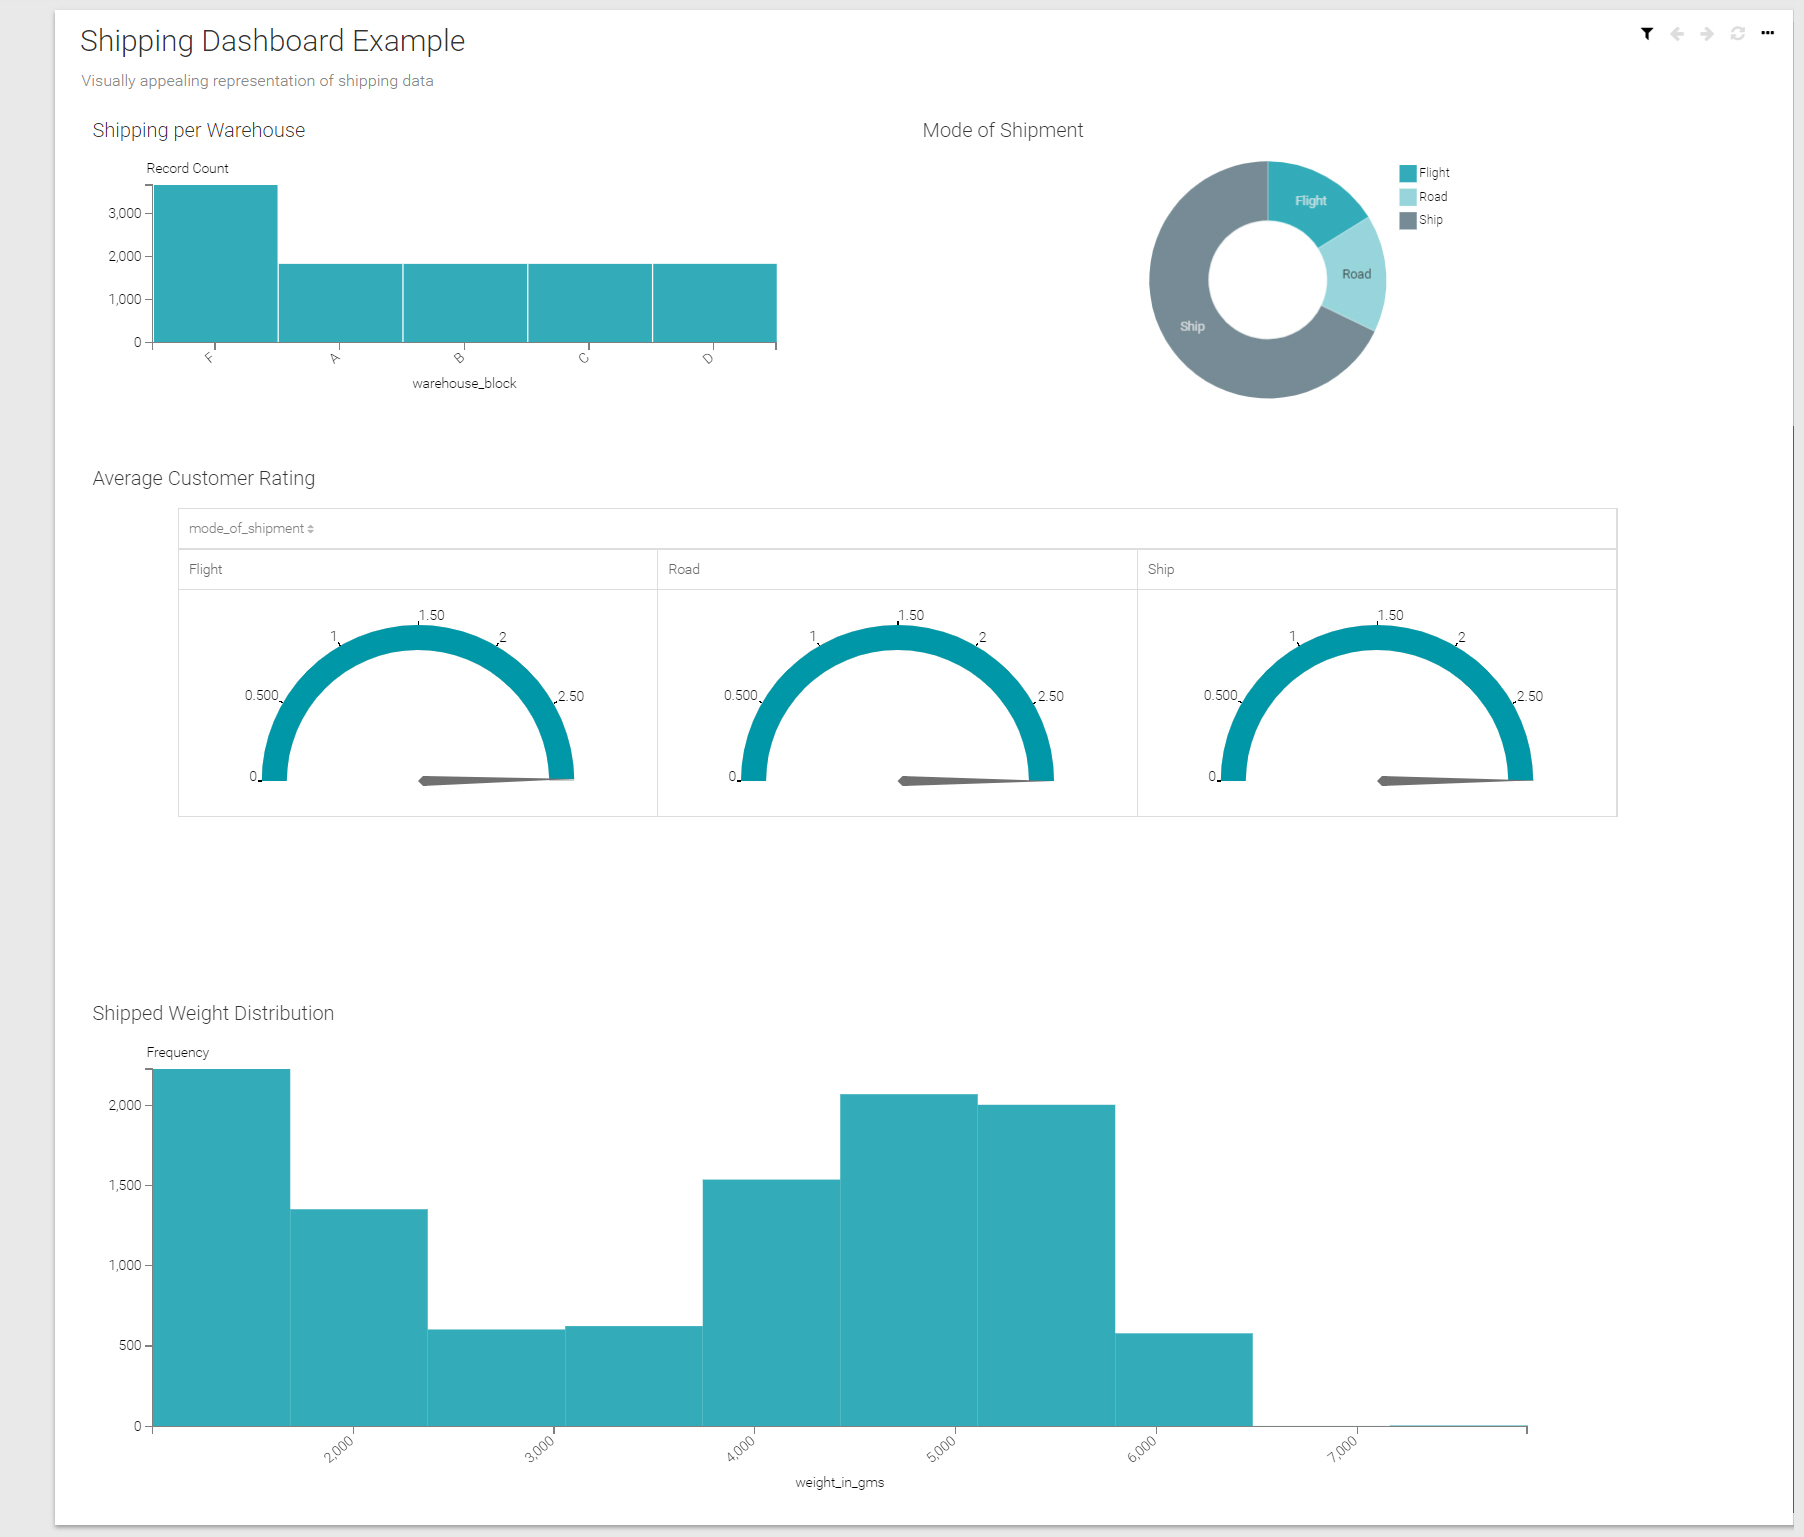
The final dashboard should look like the following:
Further reading
Other
- Have a question? Join Cloudera Community
- Cloudera Data Warehouse documentation


