Cloudera Data Visualization
Easily create rich, interactive dashboards that accelerate analytical insights across your enterprise.

Cloudera Data Visualization is now available on premises for hybrid data access. Read the announcement
OVERVIEW
Self-service visualization tools for the full data lifecycle
Cloudera Data Visualization enables data specialists, business analysts, and data scientists to quickly and easily explore data, collaborate, and share insights across the data lifecycle.
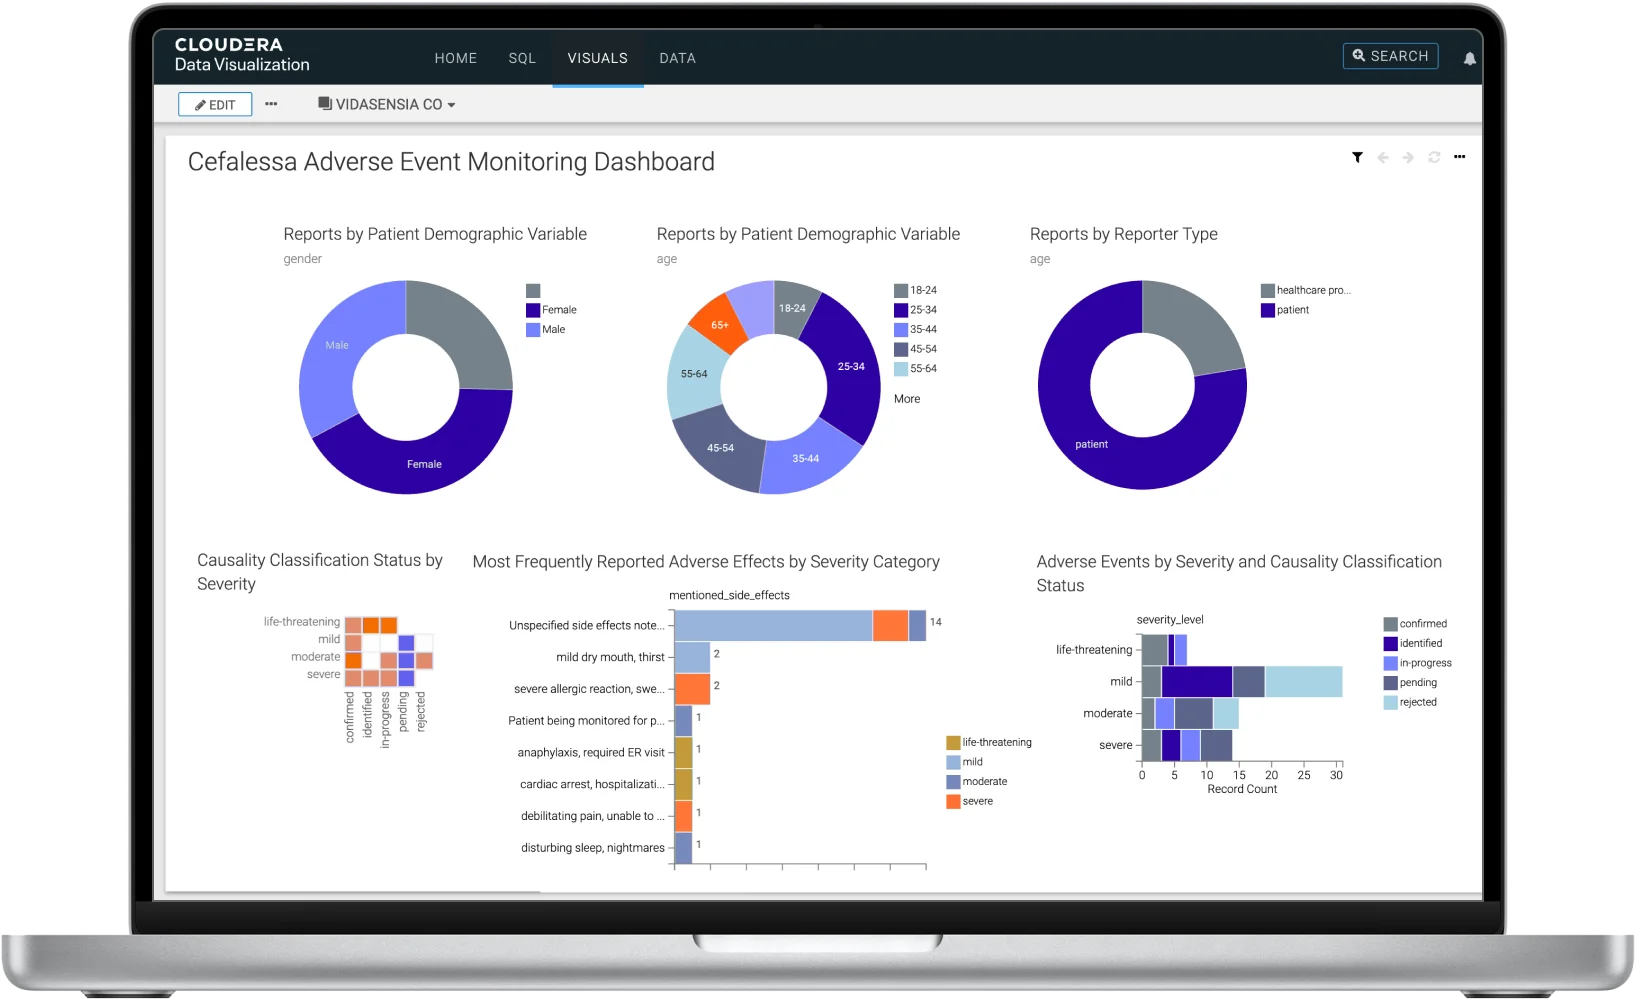
Create intuitive and accessible drag-and-drop dashboards and custom applications with a consistent and easy-to-use experience.
Access, collaborate, and generate actionable insights from all your data, fully secured by Cloudera Shared Data Experience (SDX).
Build predictive applications from ML models served in Cloudera AI or power fast intelligent reporting without moving data or using third-party tools.
USE CASES
Maximize your data's potential with Cloudera Data Visualization.
-
Unlock insights with AI-powered dashboards
Make smarter business dashboards with new AI-powered features in Data Visualization.
-
Accelerate collaboration and drive business intelligence
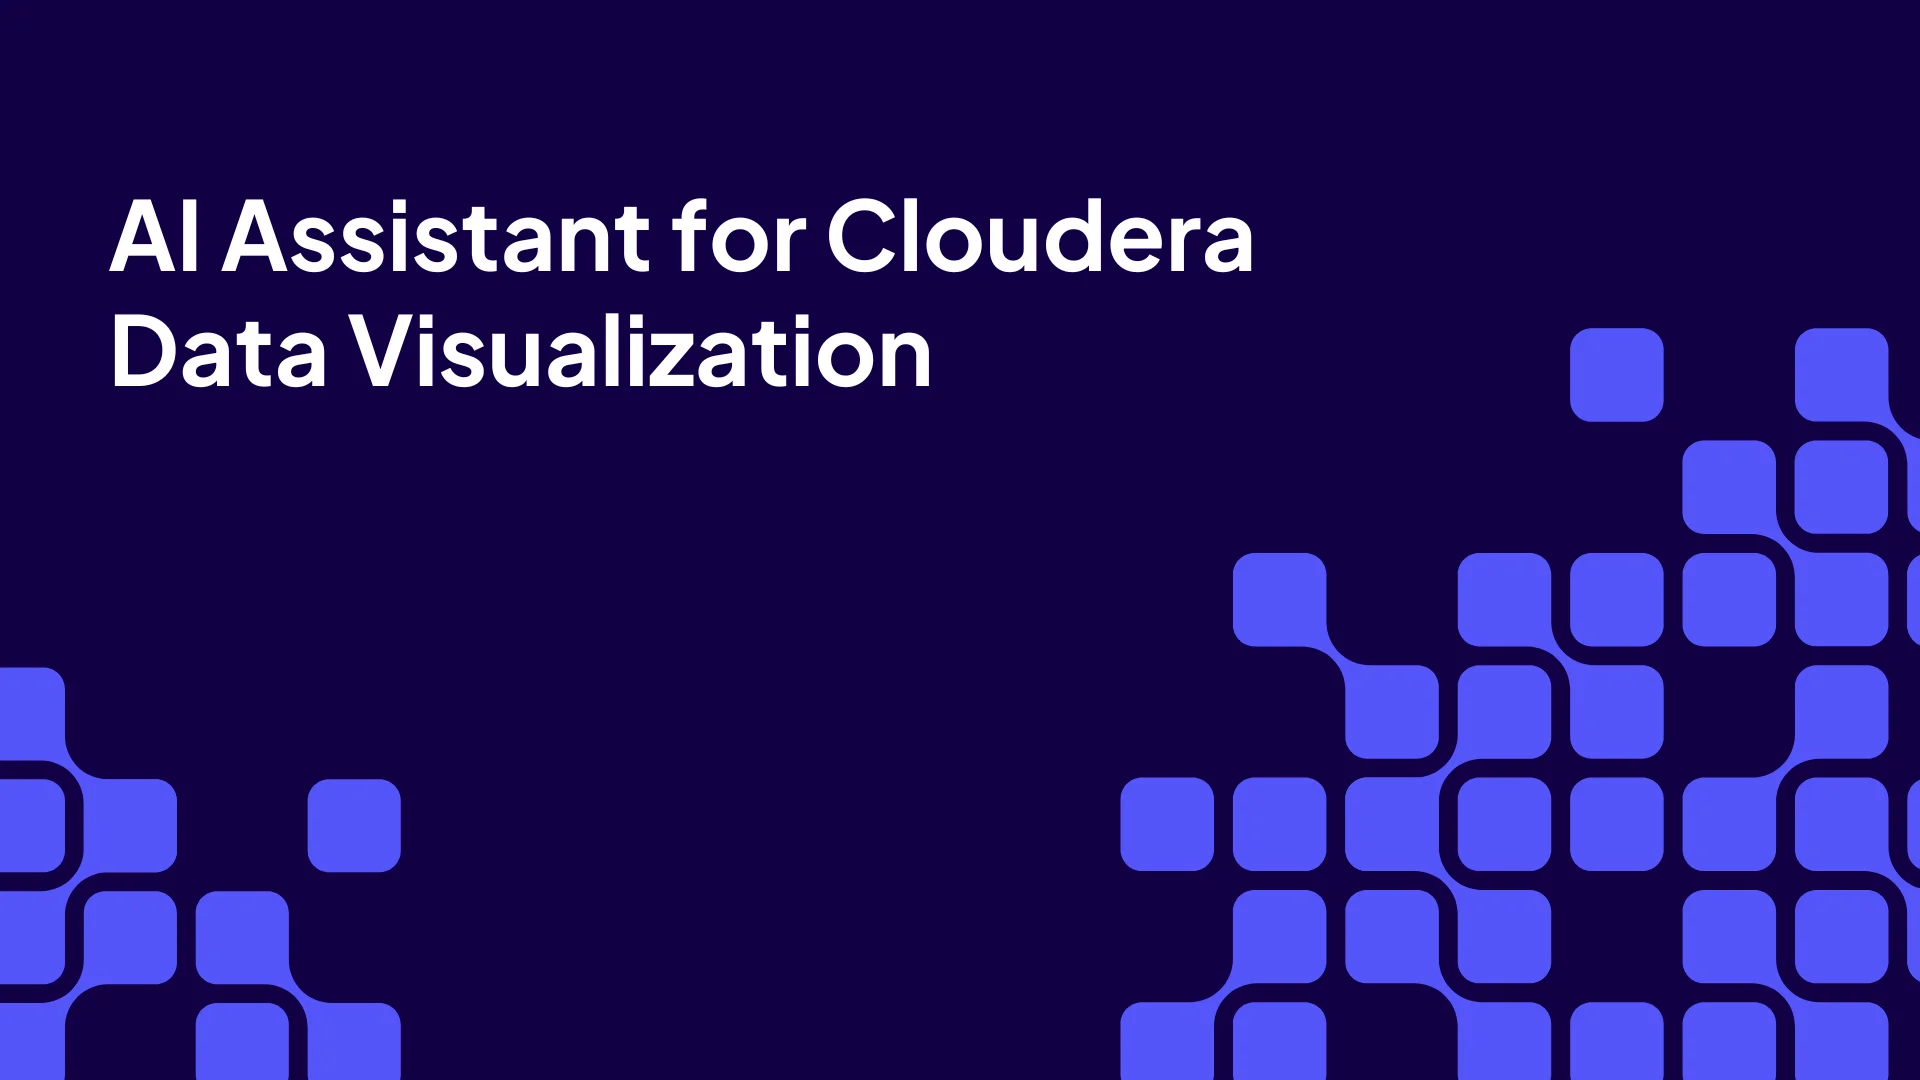
Quickly and easily build interactive dashboards and instantly share insights across your business.
-
Access data securely across hybrid environments
Leverage data from anywhere with a consistent unified framework.
-
Unlock insights with AI-powered dashboards
Make smarter business dashboards with new AI-powered features in Data Visualization.
-
Accelerate collaboration and drive business intelligence
Quickly and easily build interactive dashboards and instantly share insights across your business.
-
Access data securely across hybrid environments
Leverage data from anywhere with a consistent unified framework.
Enhance your dashboards with a natural language-based interface that's grounded in factual information about your business context.
Bring the power of AI to BI with tools like AI Visual, a built-in AI assistant in Cloudera Data Visualization.
Enable users to build and publish custom dashboards and analytic applications in minutes.
Collaborate across teams effectively with out-of-the-box visualizations, data modeling, and reporting.
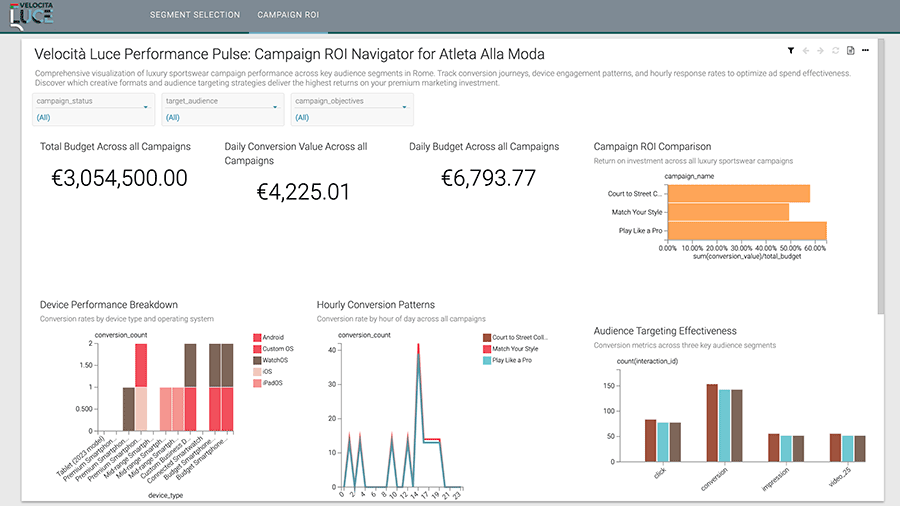
Create secured, integrated visualizations native to Cloudera with data governance through SDX.
Manage data access and use with advanced data governance features, including role-based controls.
Unlock real-time, natural-language exploration of data directly within Data Visualization. The AI Visual assistant turns written or verbal questions into insights—grounded in governed datasets and clearly presented.
Get started within minutes with more than 34 pre-loaded types of drag-and-drop visualizations. You can also use prebuilt extensions and integrations to develop applications.
Use the drag-and-drop builder to create customized, interactive dashboards. Modify the look and feel, add multiple sources of data, and combine different dashboards.
Create complex semantic layers by bringing together data types from different sources within your visualizations, add business logic and filters, or incorporate data from other visual applications.
Delivered as part of Cloudera and natively integrated with SDX, Data Visualization enables you to leverage your enterprise data from anywhere without moving, copying, or creating security gaps.
Take the next step
Explore the powerful capabilities of Cloudera Data Visualization, unlock insights with advanced AI analytics, and discover how to transform your data into actionable business intelligence.
Explore documentation
Access detailed Data Visualization product information and guides.
Take a tutorial
Learn new skills and get hands-on experience with the free tutorial Data reporting with Cloudera Data Visualization.
Explore more products
Accelerate data-driven decision making from research to production with a secure, scalable, and open platform for enterprise AI.
Simplify analytics on massive amounts of data to thousands of concurrent users without compromising speed, cost, or security.
Cloudera Shared Data Experience
Manage and maintain data access and governance policies consistently across all users, analytics, and deployments.